
Many large survey panels contain high proportions of respondents who take more than 21 surveys each week. Consider the implications of this when choosing your sample provider.
There are many options to choose from when it comes to survey vendors. Recently, we fielded the same survey with Verasight and with two large survey panel providers, Company A and Company B, to compare the survey respondent experience and response quality. We chose to collect samples with Company A and Company B because they are popular sample providers to market researchers and academics alike.
We sought to understand how frequently respondents from these three samples took surveys each week. Past research shows that respondents get fatigued over time taking long surveys (>10-15 minutes) or completing multiple surveys in a row. Fatigued respondents are more likely to engage in behaviors that lead to low quality data, such as “straight-lining” (answering with the same value down a matrix), speeding (taking a survey very quickly), or providing low effort responses to open-ended questions. If your survey provider's respondents take a large number of surveys each week, they might be more likely to speed through surveys, providing low quality and biased responses.
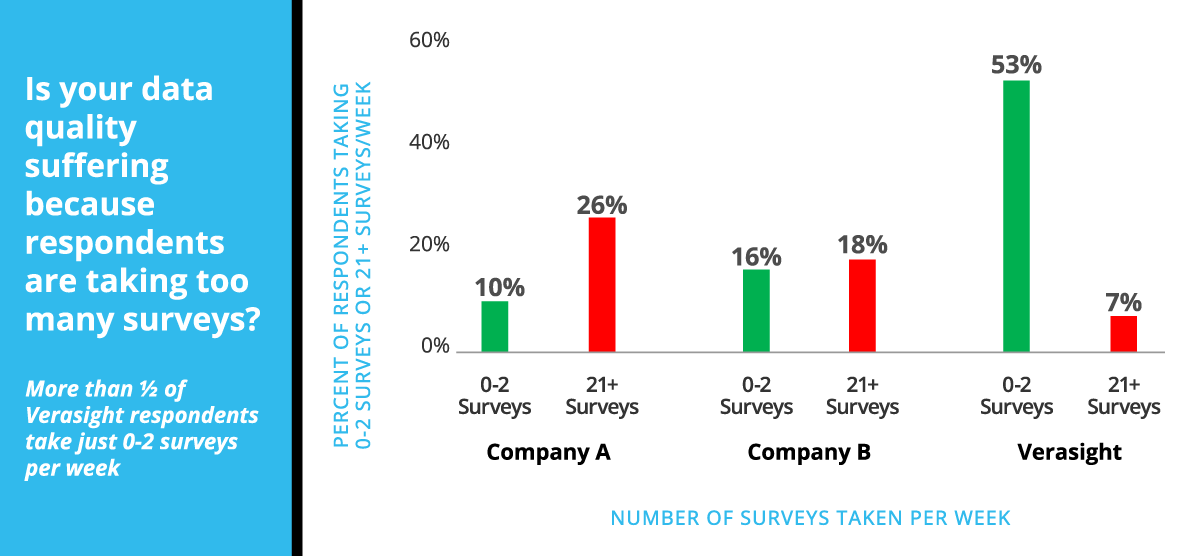
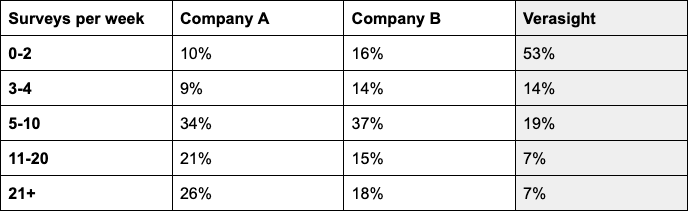
Our results show that both the Company A and Company B respondents took more surveys per week compared to Verasight’s respondents. In fact, on average, Company A’s respondents reported taking more than three times the number of surveys (10) than Verasight’s respondents (3). Looking at the distribution of responses across these vendors, 78% of Verasight respondents take 5 surveys per week or fewer, compared to 45% of Company B respondents and just 31% of Company A respondents.
Is it okay if 20% of my respondents take 20 or more surveys per week?
The greatest concern with respondents taking a high number of surveys is that these are often experienced survey takers providing low quality and biased data, which can lead to incorrect research or business decisions. In some contexts, these survey takers may be an advantage. For example, if the goal is to obtain a lot of respondents quickly, a vendor with access to a large number of survey takers–regardless of the volume of surveys each respondent takes–could be an advantage. But researchers and marketers should be mindful of the potential downside of basing decisions and conclusions on people who take so many surveys.
Wondering if Verasight is the right sample provider for you? Reach out to our team today to learn more.
Survey Details:
Verasight:
The Benchmarking Survey A was conducted by Verasight from January 30 - February 23, 2023. The sample size is 1,000 respondents. All respondents were recruited from an existing Verasight panel, composed of individuals recruited via both address-based probability sampling and online advertisements.
The data are weighted to match the Current Population Survey on age, race/ethnicity, sex, income, education, region, and metropolitan status, as well as to population benchmarks of partisanship and 2020 presidential vote. The margin of error, which incorporates the design effect due to weighting, is +/- 3.1%.
To ensure data quality, the Verasight data team implemented a number of quality assurance procedures. This process included screening out responses corresponding to foreign IP addresses, potential duplicate respondents, potential non-human responses, and respondents failing attention and straight-lining checks.
Company A:
The Benchmarking Survey B was conducted by Company A from January 20 - January 26, 2023. The sample size is 1,002 respondents. Respondents were recruited from a variety of vendors sampled through the Company A survey sample marketplace.
The data are weighted to match the Current Population Survey on age, race/ethnicity, sex, income, education, region, and metropolitan status, as well as to population benchmarks of partisanship and 2020 presidential vote. The margin of error, which incorporates the design effect due to weighting, is +/- 3.4%.
Company B:
The Benchmarking Survey C was conducted by Verasight from February 9 - February 23, 2023. The sample size is 1,014 respondents. Respondents were recruited from a variety of vendors sampled through the Company B survey sample marketplace.
The data are weighted to match the Current Population Survey on age, race/ethnicity, sex, income, education, region, and metropolitan status, as well as to population benchmarks of partisanship and 2020 presidential vote. The margin of error, which incorporates the design effect due to weighting, is +/- 3.3%.
To ensure data quality, Company B implemented a number of quality assurance procedures. This process included screening out responses corresponding to respondents who failed straight-lining checks, gave nonsensical answers on open-ended questions, and showed patterned responses.