.png)


Introduction
Surveys are becoming increasingly difficult to field, and with that difficulty comes rising costs and questions about representativeness. Roughly 0.5-2 percent of Americans will answer a pollster’s calls and text messages to complete an interview. At the same time, researchers have developed a new technology that combines survey data and artificial intelligence to produce cheap, rapid survey responses at scale: simulated respondents, or “digital twins,” that take the place of humans in the interview process. Could this be the solution to pollsters’ woes?
This month, Gallup announced it had begun researching whether this technology — which combines large language models and other AI systems to “answer” questions sent by a researcher — could work for its business. It is not the only firm doing so: Other pollsters and survey research companies have launched similar research efforts and products over the last year.

Over the past year, Verasight has conducted four studies to determine whether AI-generated responses can accurately replicate human response patterns. The first four produced largely discouraging results. The fifth, a new study presented in this article, represents our attempt to steelman the entire approach: to build the strongest synthetic polling pipeline we could, then evaluate it against real Verasight data.
Our verdict is this: “synthetic samples” can recover the topline structure of partisan opinion on a narrow set of high-salience political questions. On almost everything else, and at the crosstab level, they still fail in systematic, impactful ways. The best way to think about “digital twins” and other synthetic samples is that they are predictions, not measurements of public opinion, and thus, are only as accurate as the underlying model of the response variable. AI models may have a lot of information about how Americans feel about President Donald Trump, for example — a question on which pollsters have published thousands of poll results for LLMs to train on — but the models for novel questions of public opinion are severely lacking. As a result, the true cost of using “synthetic samples” is extremely high: incorrect conclusions and flawed insights.
1. Existing work
Out of the box, LLMs fail on every dimension
To briefly recap, our first study tested the simplest version of this technology. We extracted demographic traits and party identity for 1,500 human Verasight respondents, developed “personas” for each (by listing their traits in a paragraph of text), and asked GPT-4o-mini to predict how someone with each given persona would respond to three questions: Trump approval, the generic ballot, and a novel housing-zoning item. We then compared the synthetic answers to the actual survey toplines and crosstabs.
The topline result looked superficially tolerable: Trump approval was off by about four points, slightly above what you’d expect by just fielding another survey. For a nascent technology that is promising: Maybe this could work after all?
Unfortunately, everything beyond the Trump approval and Democrat/Republican vote toplines broke down quickly. Crosstab-level errors, for example, reached 30 points for small subgroups. Opinion among Hispanic and Black respondents was off by roughly 15 points on average. At the individual level, the model flipped about 20 percent of real Trump disapprovers into synthetic approvers. And on the out-of-sample zoning question — “Would you prefer limiting local zoning rules to build more homes, or allowing local zoning rules to stay unchanged?” — the model swapped the leading position, exaggerated both sides, and produced essentially no “Don’t Know” responses.
That was our first lesson: demographic personas alone are not enough. The model can often infer the direction of a national partisan signal, but it does not preserve enough individual- or subgroup-level structure to be used as a substitute for real survey data.
More information does not reliably help - and often hurts
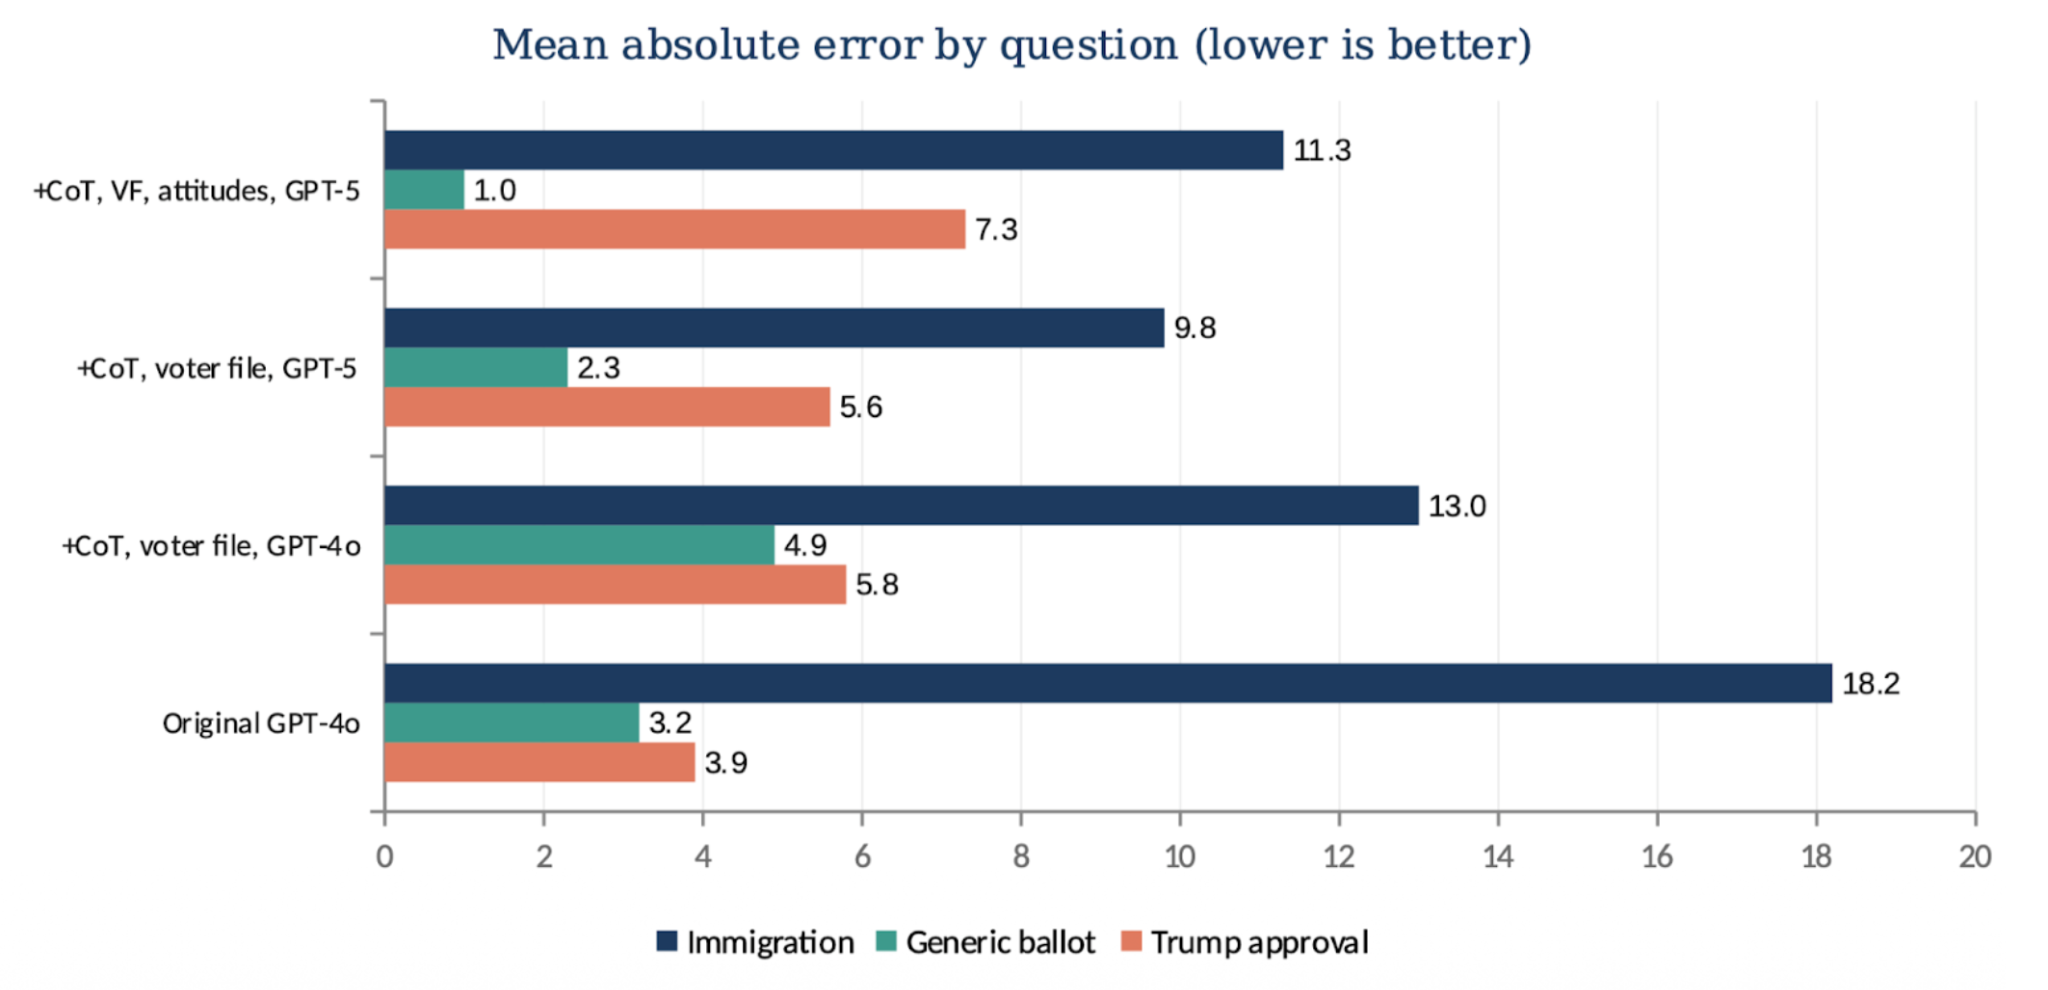
The natural next step was to give the model more context about each respondent. In the second study, we added so-called “chain-of-thought” prompting, real voter-file turnout history, an attitudinal anchor on support for Donald Trump’s tariff policy, and GPT-5 to our imputation pipeline. Each change was designed to increase some part of the respondent-level response model; more information about voters and their attitudes should improve calibration for responses to new questions, and the updated underlying large language model should contain more embedded information about human response patterns.
These changes, however, did not lead to consistent performance gains across questions. Some additions helped on some questions but hurt on others. Our prediction of respondents’ vote in the 2026 midterms (the so-called “generic ballot”) improved the most in the information-rich configuration. But our predictions of Trump’s job approval rating got worse in the same configuration, and immigration remained badly off across specifications. More data did not automatically make the simulated respondent more realistic.
This is one of the most important practical findings from the entire project, and we will see it reinforced again in section 3. LLM prompting is not a normal “feature-engineering” problem where adding relevant information for each individual helps prediction. More information, and even more "advanced" LLMs, can make synthetic samples less accurate. This is because the response model is not actually trained on the correlation between features and outcomes, as a normal survey regression would be, but rather an entirely different predictive model of language from many other sources. As discussed in the last section, one area of improvement for “digital twin” technology is in combining both statistical and AI models of responses.
Non-political questions are even worse
In a third study, we tested how well (poorly) the AI imputations worked on non-political questions. Using our state-of-the-art imputation pipeline with a new LLM model, GPT-5.2, we simulated responses for 2,000 respondents across 52 single-answer questions in six topic areas: health care, society, education, technology, life, and politics (multi-response questions, where synthetic respondents were allowed to select all responses that applied, performed so poorly that we excluded them from the main analysis). Results are shown in Figure 3:
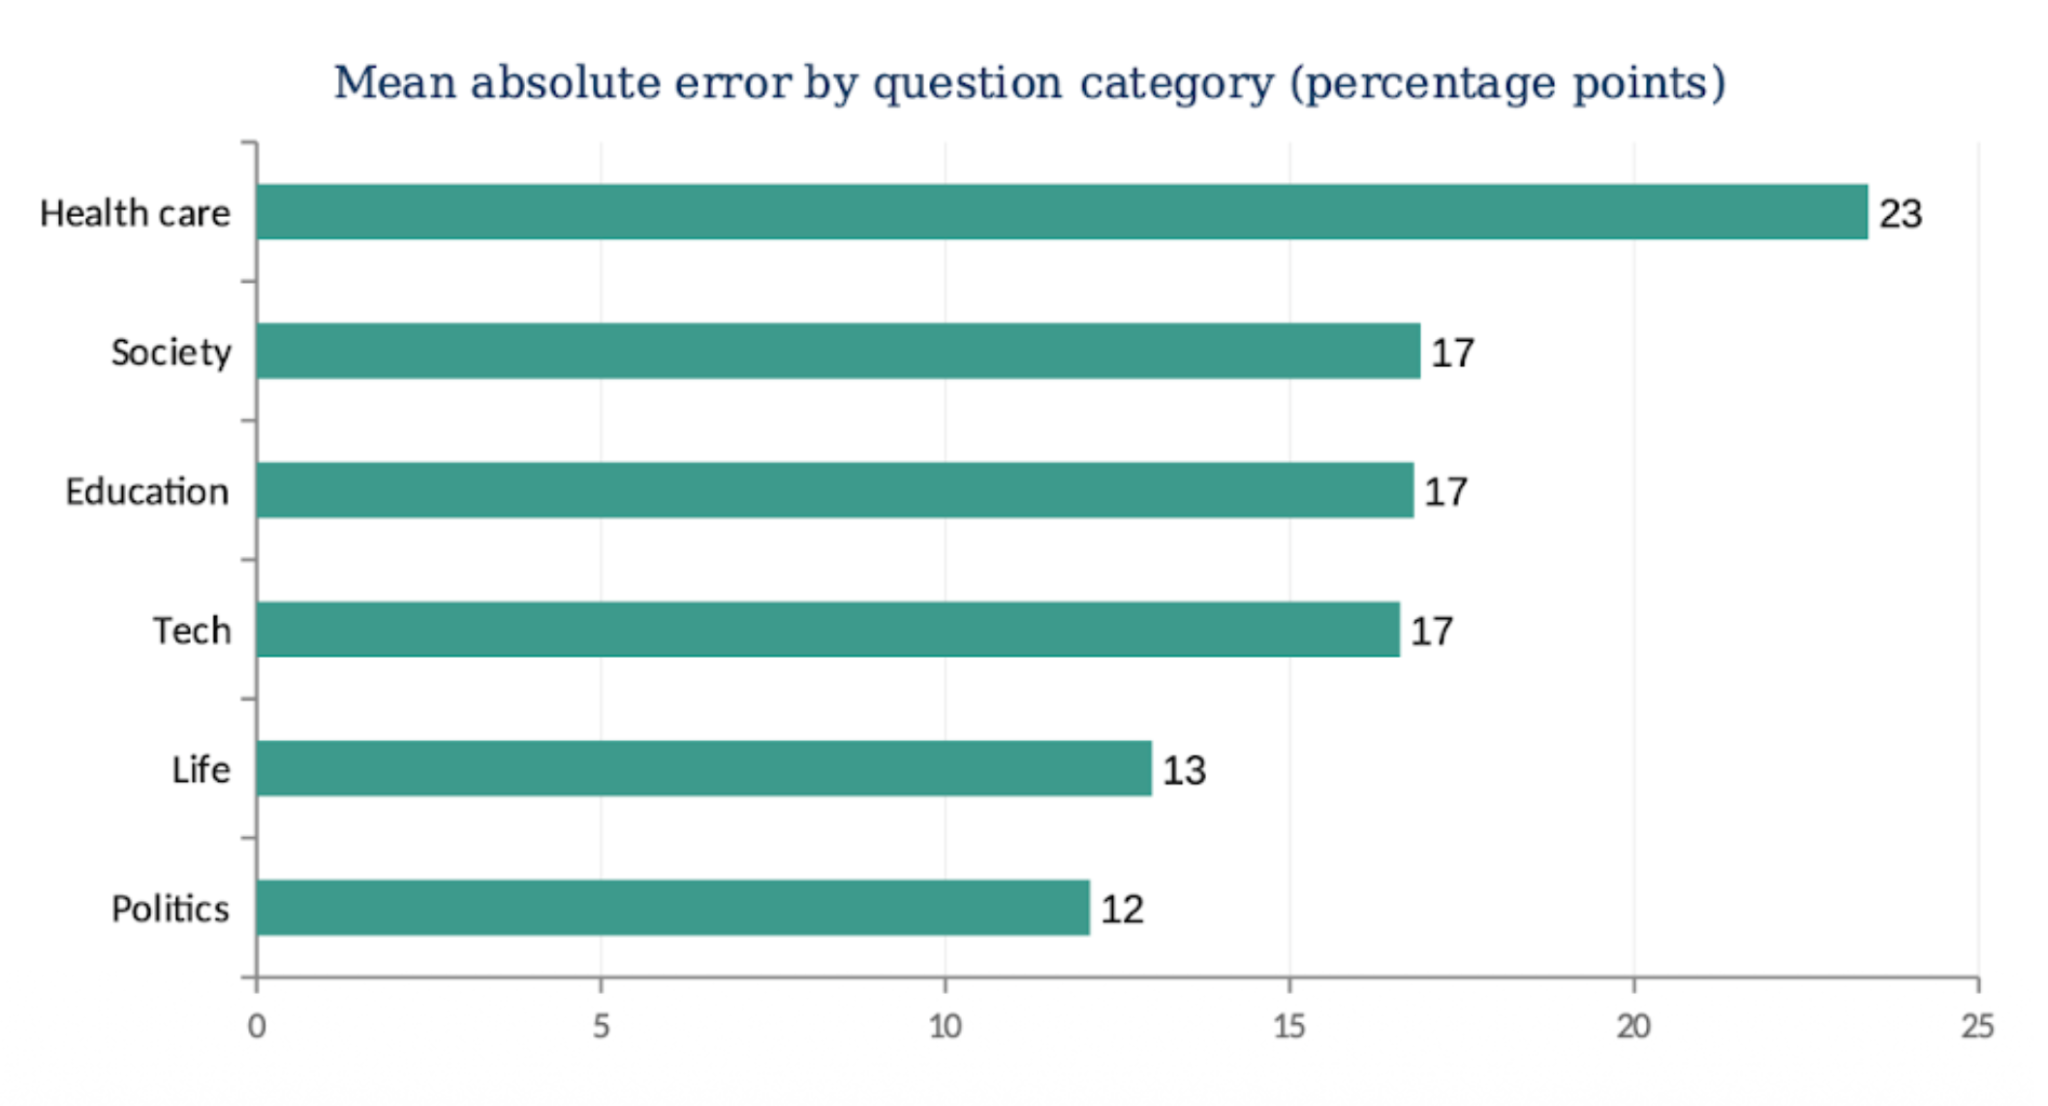
Across 305 response options, the model posted a mean absolute error of 14.5 points. If anything, our previous tests on political questions generate the best-case results for synthetic samples.
Remaining questions
These three studies left several open questions about the promise of synthetic data. Could a richer set of attitudinal covariates — three or four questions matched from Verasight’s panel rather than a single anchor question — give the model a more realistic portrait of each synthetic respondent? We also wanted to test a new methodology for response generation called “verbalized sampling,” in which the model reports the probability of giving each response option rather than committing to one. And more broadly, were our earlier pipelines simply too sparse and underspecified to give the approach a fair hearing? We decided to answer those questions by taking the strongest possible version of synthetic sampling seriously, and generate our own synthetic polling pipeline from the ground up.
2. Methods: Building a synthetic poll from the ground up
We built a new pipeline — codenamed THESEUS after the old Greek myth — to push digital twin technology as far as we could take it. Instead of asking an LLM to infer opinions from demographic stems, derived from respondents in an existing survey sample, we built a full bottom-up agent pipeline that samples respondents from Census microdata, attaches attitudinal variables from tens of thousands of Verasight interviews over the last year, and generates responses using a sophisticated LLM prompting pipeline. Then, we evaluate it against real survey benchmarks.
The graphic below summarizes the methodology.
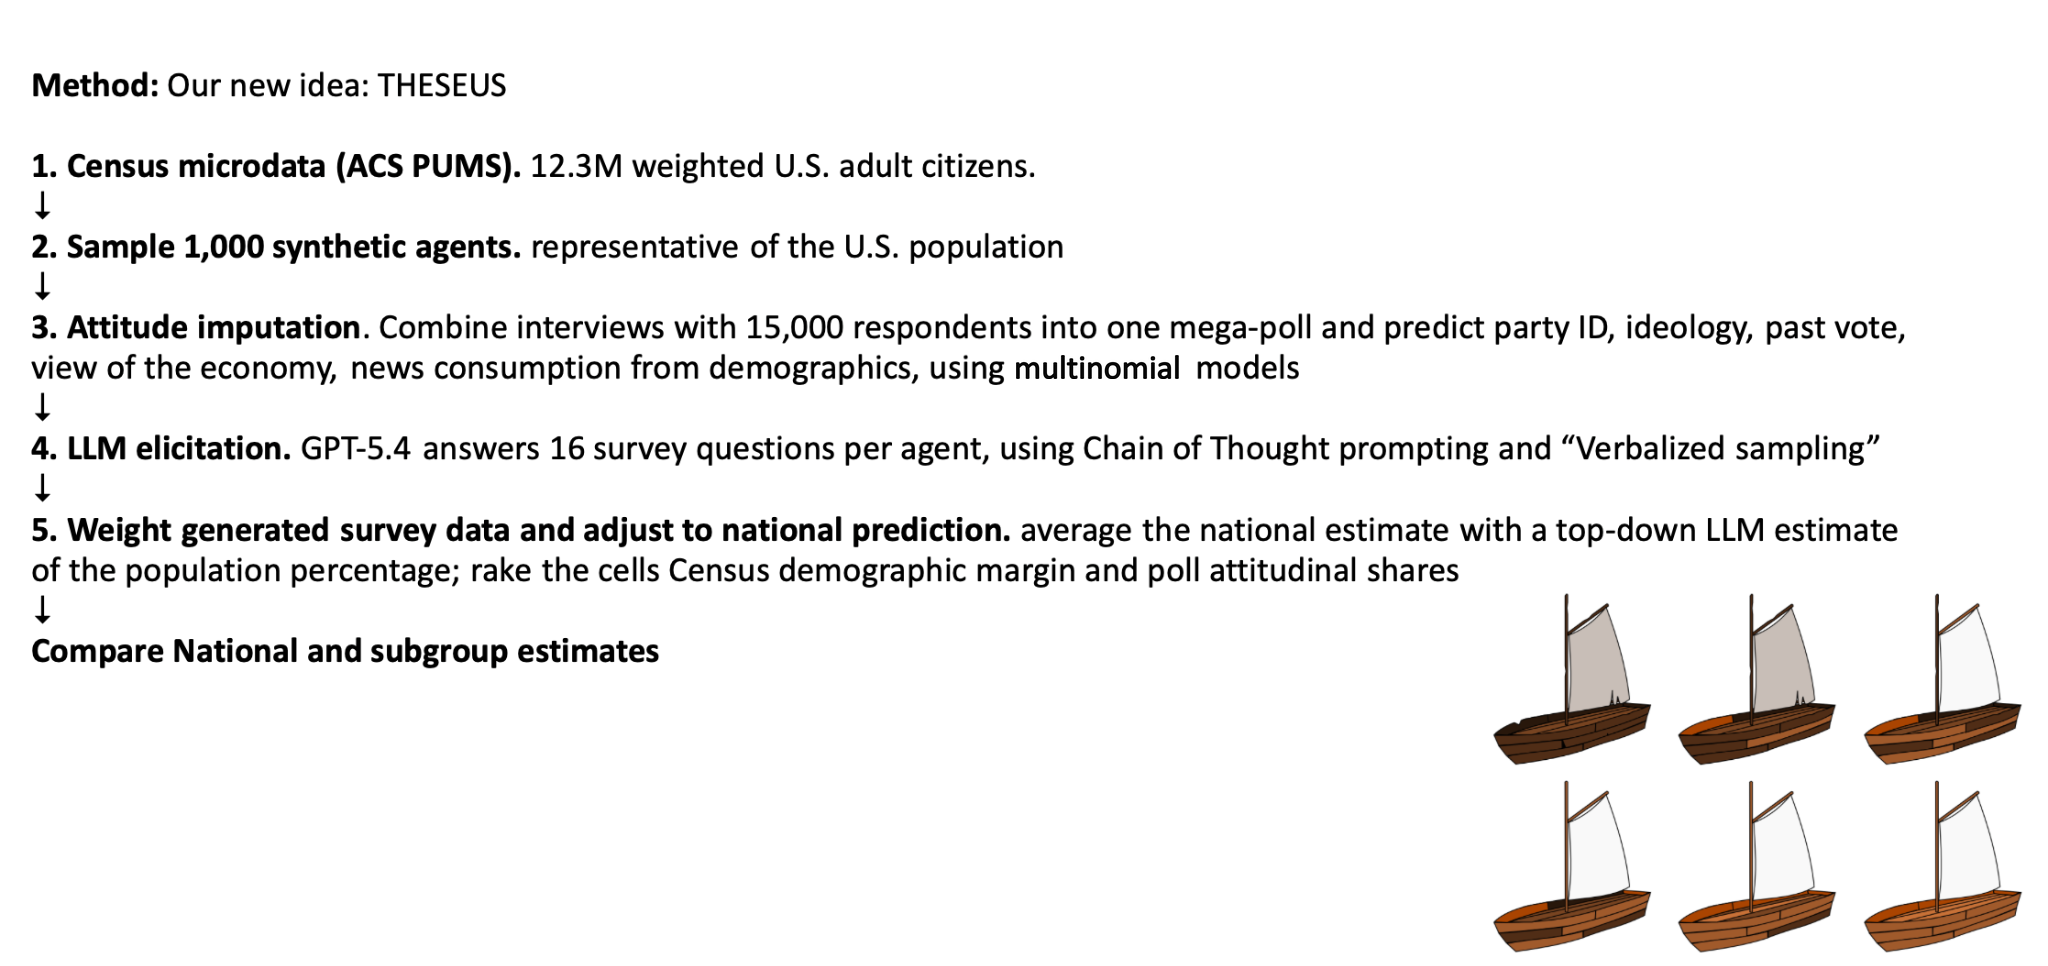
The pipeline has five steps.
First, we sample 1,000 synthetic “agents” from the 2023 American Community Survey Public Use Microdata Sample, restricted to adult U.S. citizens. The full frame represents about 12.3 million weighted adult citizens. Each agent inherits a real person’s demographic and geographic profile: their age, sex, race and ethnicity, education, income, state, and local geography (their Public Use Microdata Area, or PUMA). As shown in the appendix, increasing sample size for the simulations does not increase accuracy; we stick with the n=1,000 benchmark since that’s the size of a good high-quality national poll.
Then, we enrich those agents with additional context about their geography to improve the accuracy of calibration weights and our subsequent AI agents. Each person gets PUMA-level variables for median income, racial composition, and 2020 presidential vote share.
Third, we impute political attitudes for each agent. We pooled ten surveys conducted on the Verasight panel for a political polling client (one of the authors of this post!), between May 2025 and March 2026 to create a pool of roughly 15,000 “donor” respondents that can lend their response data to our agents. We do this by training separate multilevel regression models to predict party identification, ideology, 2024 vote, personal economic assessment, and news consumption from respondents’ real demographic and geographic predictors. Then, we use those models to predict the traits of our agents. We found that this imputation approach was generally more accurate than matching survey respondents to agents via some demographic/geographic distance metric — what gets called “matched sampling” in the survey literature.
Fourth, with survey “agents” that have demographic, geographic, and attitudinal context informed by Census and real survey microdata, we turn to asking the LLM for survey answers. For each agent, we fed GPT-5.4 their demographic profile, imputed political attitudes, and geographic context, and asked for a probability distribution over each response option for 16 target questions. The output from this call is a list of lists of numbers for each response to each question — representing, e.g., that an agent may be 65 percent likely to approve of, 30 percent likely to disapprove of, and 5 percent likely to say they do not know how they feel about Donald Trump’s presidency; and that they are, say, 20 percent likely to have heard of recent military action in Venezuela.
Finally, in one optional test variant of our pipeline that we call “anchored response generation,” we also nudge the respondent-level response probabilities toward an aggregate population estimate informed by a top-down LLM estimate of the distribution for each answer. This estimate is elicited directly by the LLM API interface by asking it, for example, to “Do deep research on the topic area of the following survey question and estimate what percent of the population would give each answer in the listed response options.” Agents are “nudged” partway to the national result via the “logit shift”, which moves each agent’s probability a uniform amount such that the weighted population estimate is halfway between the original bottom-up estimate and the direct top-down estimate.
We can then treat this LLM-generated data as normal survey data and input it into a standard weighting pipeline to aggregate to the population level for testing. Weights for each agent are raked to Census margins for demographic variables and the cross-survey marginals from Verasight’s donor pool for political attitudes, including for the interaction of race and partisanship.
Crucially, the model never sees the answers against which it is being evaluated. THESEUS is designed to compete with polling, given publicly accessible Census microdata and survey data (n=15,000) that would be reasonably cost-effective to obtain (around $65-70,000 on Verasight’s panel), not to quietly mirror it.
3. Results
Our enhanced “digital twins” technology is very accurate on high-profile toplines
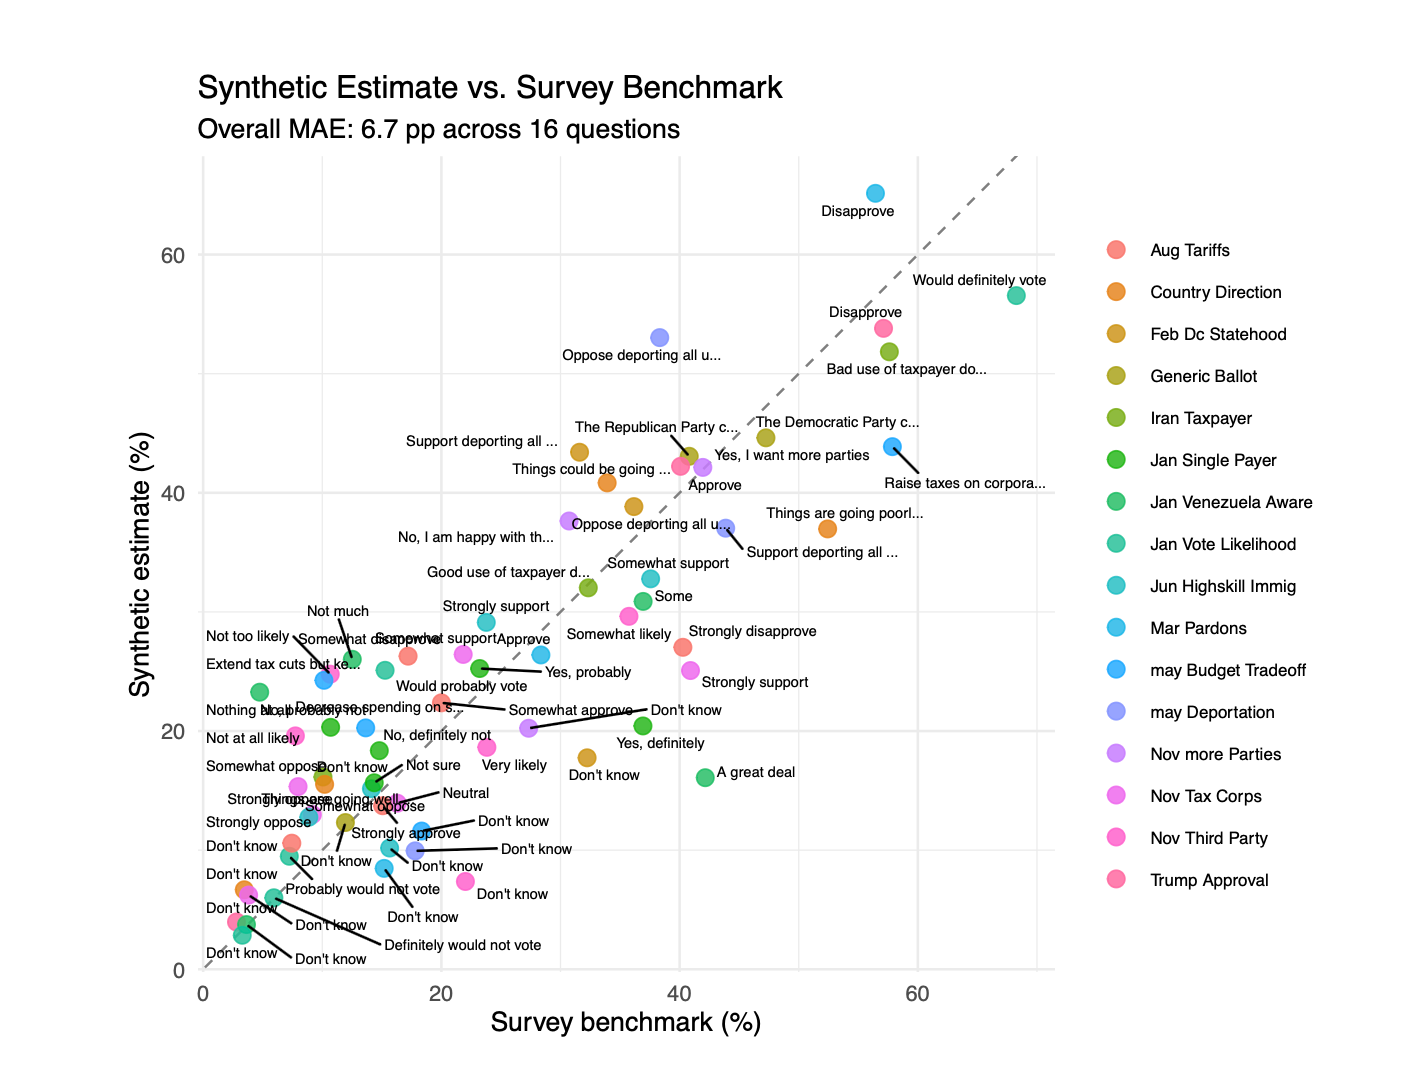
Across all 16 questions, THESEUS produced an overall mean absolute error of approximately 6.6 percentage points, with a median question-level error of 5.7 points. On highly polarized political questions, THESEUS cuts error by about 60% relative to our first experiments — a significant improvement — but still cannot accurately measure opinion on “out-of-sample” topics (e.g., events like the U.S. operation in Venezuela that happened after the underlying large language model we used was trained — so the LLM had no information about that event in its knowledge base). Reference percentages for each response option are calculated from the pooled responses of our 15,000 donor interviewees.
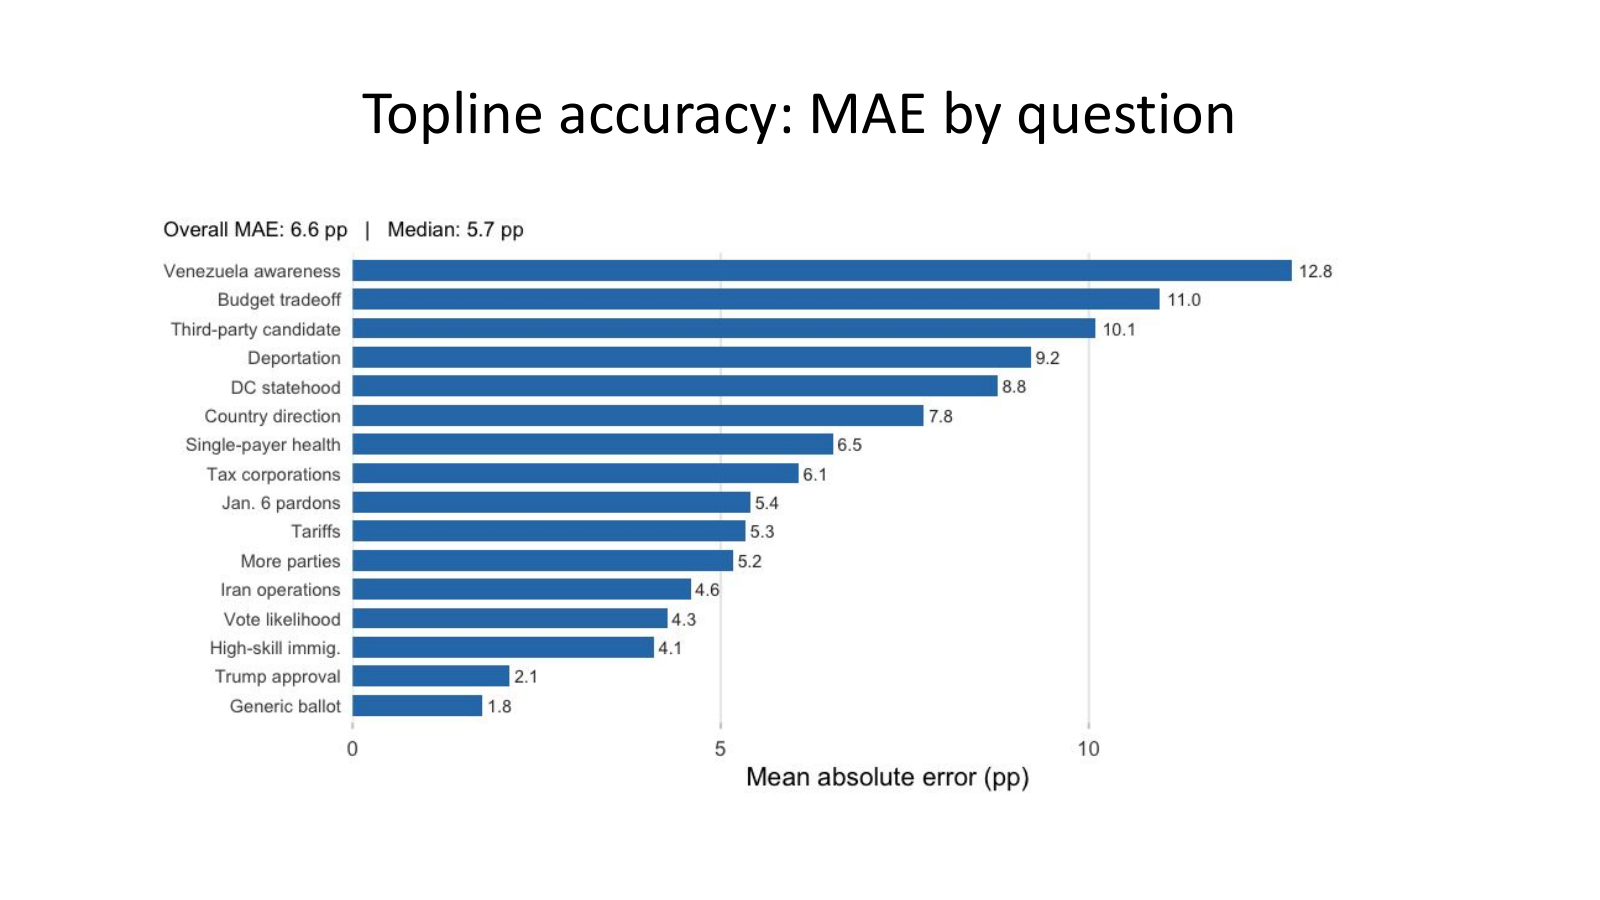
On the generic ballot, THESEUS misfired by 1.8 points across response options. On Trump approval, it missed by 2.1 points. Those are close to the degrees of deviation one might expect if they conducted repeat polls of roughly the same size and compared results across surveys.
However, not all imputations are created equal. The model missed a question about awareness of recent events in Venezuela by 12.8 points, a question about the federal budget by 11.0 points, and vote likelihood for a third-party candidate in Congress by 10.1 points. It missed desired federal deportation policy by 9.2 points, and support for DC statehood by 8.8 points. Mean absolute error for the best and worst questions differs by about 7x. Language for each question is detailed in Appendix B of this paper.
This pattern is not random. THESEUS works when the answer is mostly predictable from stable political identity. Party ID, ideology, and vote choice capture over 95% of the variance in presidential approval and the generic ballot, and the underlying LLM has clearly learned the relationship between these variables. But it struggles when the answer depends on issue-specific knowledge, recent news, low-information instincts, institutional reasoning, or genuinely unsettled preferences - exactly the things partisan identity does not predict well.
The scatterplot in Figure 6 presents a visual comparison of the LLM predictions and benchmarks for 16 questions. The synthetic estimates move broadly in the right direction, but the cloud does not collapse onto the diagonal. There is real signal here, and real systematic error.
How to measure accuracy: Not zero, but the “sampling floor”
One important methodological point is that the benchmark for synthetic data is not perfect calibration, since a real survey would not reproduce the full benchmark exactly either. So we benchmarked the THESEUS system against a “floor” for sampling noise: If we re-ran our real polls of 1,000 adults many times, how far off would we expect these polls be from the original survey?
The “sampling floor” is computed by repeatedly drawing 100 draws of n=1,000 respondents from the survey microdata. The gray bars in the Figure 7 show the average deviation of these mini-polls from the real data — the error poll of the same size would be expected to produce from sampling variance alone. The blue bars show the error rates for THESEUS.
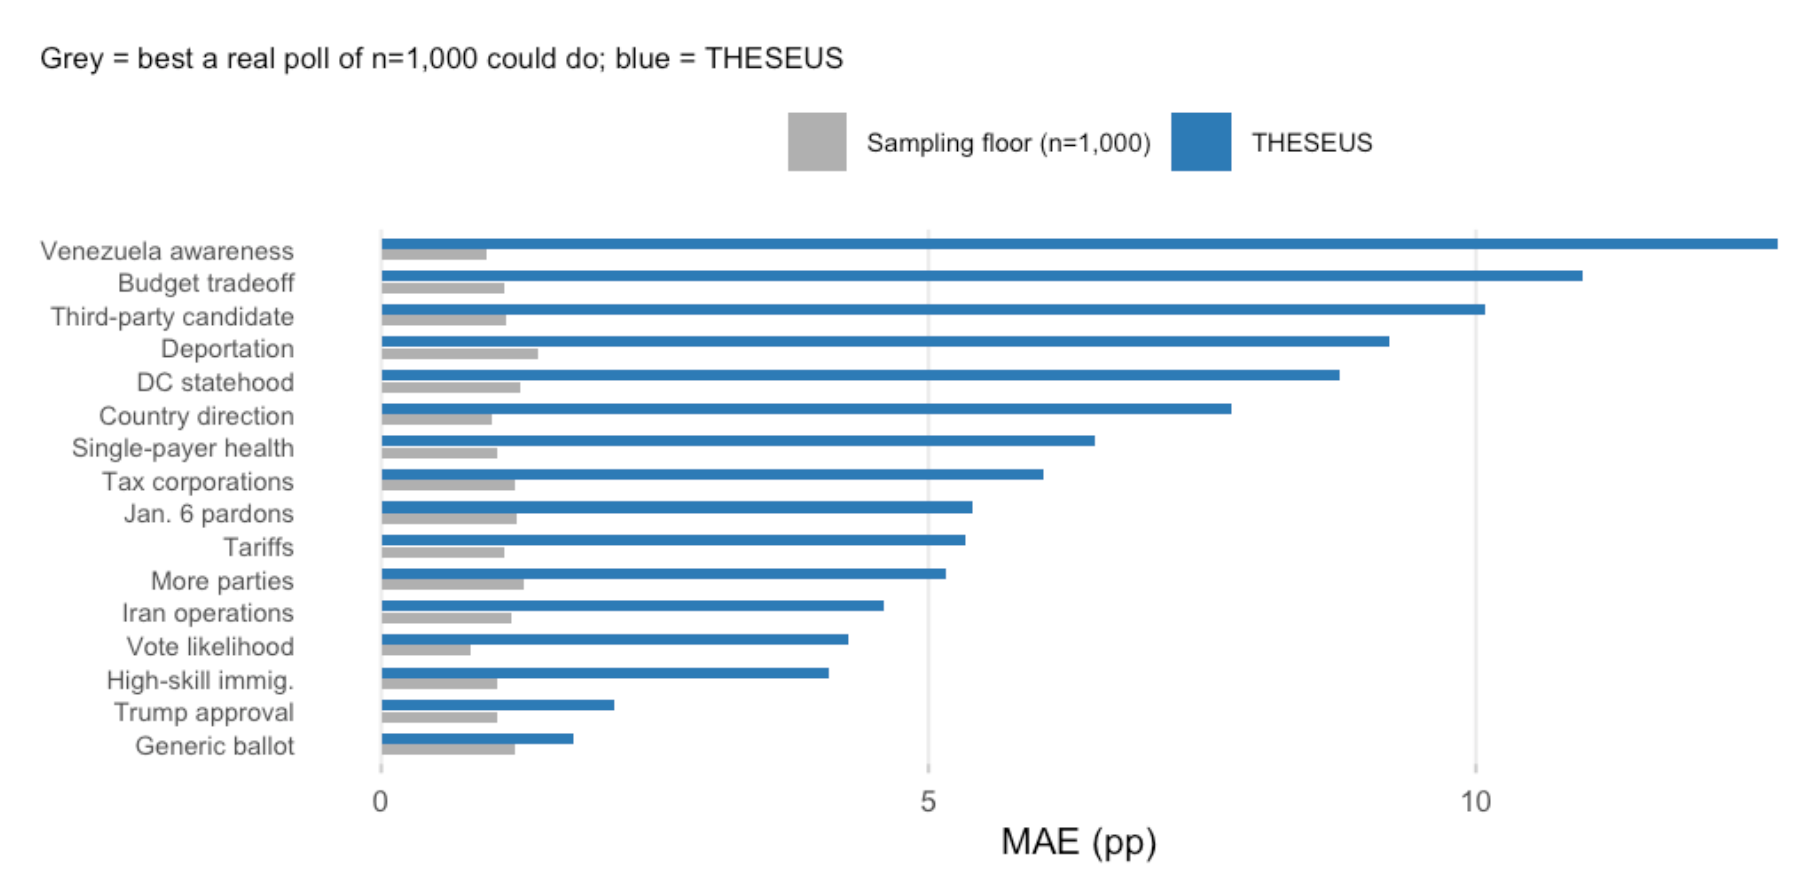
On high-salience partisan questions, THESEUS approaches the sampling floor. On the generic ballot and Trump approval, the topline error rate is close to what one would expect from a real poll of approximately 1,000 respondents. That is genuinely impressive, yet on a broader set of political questions — vote likelihood, high-skill immigration, Iran operations, January 6 pardons, and tariffs — the synthetic data still falls short.
These errors would not be fixed by a larger synthetic sample, because they are not sampling errors, they are model errors.
Subgroups are still harder to get right than toplines
As in our previous investigations, we find evidence that national topline error rates are hiding substantial offsetting errors at the subgroup level. The methodology employed here can overstate support for opinion X among one group and understate it among another, making it look acceptable in the aggregate because the errors cancel. This becomes obvious once you calculate the average error for each question by key demographic categories:
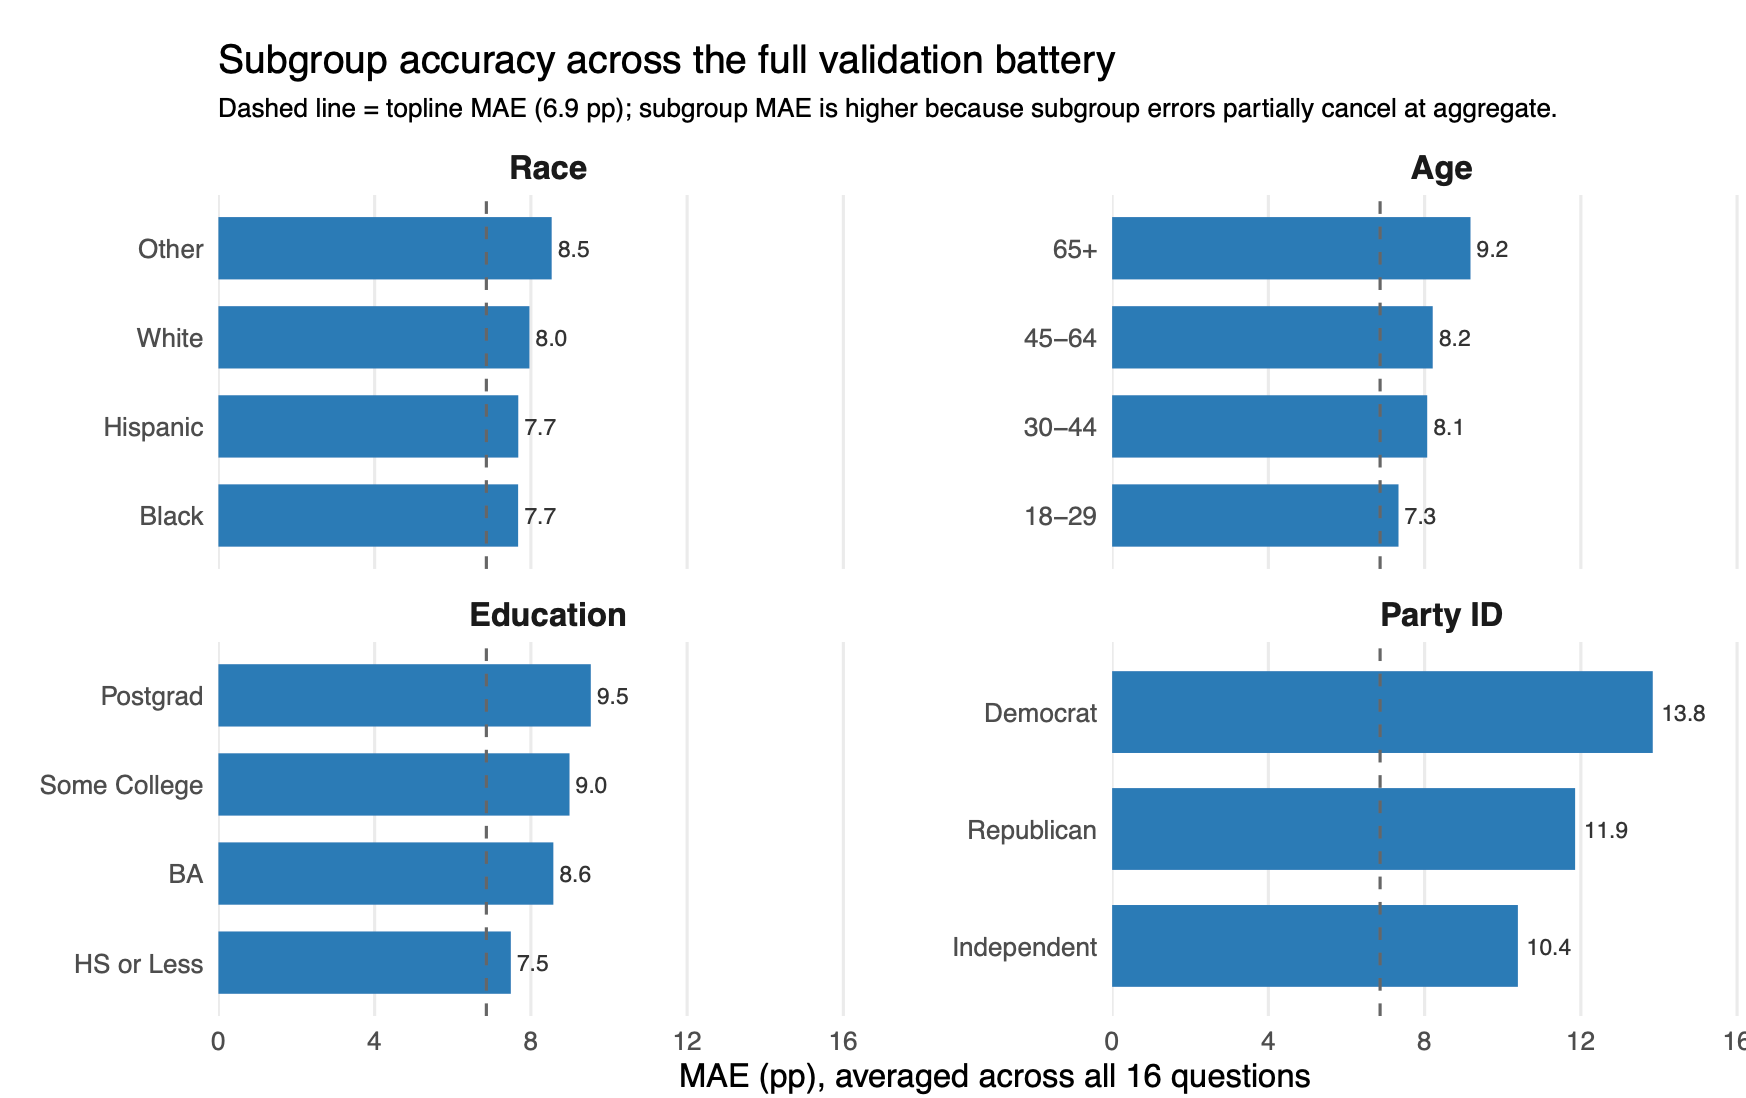
Errors were calculated by averaging the absolute error of each response to each of the 16 questions listed in figure 7, grouped by subgroup.
Across demographic and partisan crosstabs, subgroup MAE is consistently higher than the national topline MAE. Race and age errors are mostly in the high single digits. Education cuts range from 7.6 to 9.6 points. Surprisingly, party-ID cuts are worse: 10.4 points among independents, 11.7 among Republicans, and 13.8 among Democrats. That compares to a mean absolute error of 6.6 points for toplines.
This means the subgroup error in LLM imputations works differently from standard surveys; in standard surveys, there's more uncertainty around demographic subgroups than partisan groups due to smaller sample sizes (there are more Republicans in the poll than Black voters) — but that's not the case here. In the LLM imputations, responses are systematically biased toward 50/50 when broken down by party ID — Republicans are not right-leaning enough and Democrats are not left-leaning enough. Paradoxically, the LLM does not have a problem underestimating uniformity for other fairly homogenous groups, like Black voters, young people, and college graduates (all who lean substantially Democratic).
This does not mean the subgroup estimates contain no information. But it does mean they should not be read like ordinary crosstabs from a real poll — which significantly limits the potential use case for these methods.
Imputation error in agent creation
It is tempting to blame the large language model for the whole of the error in our research. But there is also uncertainty in the way we attach attitudes to each agent in our sample. Because we do not observe party ID and past vote in Census data, and these traits are key to generating accurate survey responses, we have to impute those attitudes onto the underlying American Community Survey data.
Each agent gets a response to our attitudinal variables from a conditional distribution estimated by a multilevel model trained on the pooled Verasight corpus. While this is a reasonably accurate technique, it is not perfect. We graded the accuracy of these models by predicting respondents' attitudes on our five attitudinal covariates, then comparing the resulting national toplines to the actual real-world results of those polls. Overall, imputed responses miss the real-world distributions by about 3.6 percentage points. The remaining ~3.0 points of error in our pipeline comes from the accuracy of LLM imputations.
This represents real progress compared to our first analysis, but it is also a warning. Even if we had perfect imputation of key attitudinal variables, the remaining error appears to be structural in the model’s simulation of individual opinion. That is not something that disappears with a more clever prompt (we tried). To reduce that error significantly, a researcher may find additional accuracy by “fine-tuning” underlying LLM models (training them again on structured data that is more relevant to a researchers’ domain) to survey data — which, for questions about novel world events, would require running original surveys anyway, defeating the purpose of the LLM simulations in the first place.
What really moves the needle on accuracy
Before wrapping up, we will note several iterations of our methodology that improved our results.
Step-by-step reasoning of an agent’s persona — what AI engineers call “chain-of-thought prompting” — produced the largest improvement. Asking the model to reason through party identification, ideology, vote history, demographics, engagement, and media diet before answering helped keep the agent profile salient across a long batch of questions. In the THESEUS experiments, this reduced overall MAE from roughly 8.0 to 6.7 points.
The use of an external, top-down anchor for each question also helped, especially on difficult questions involving recent events. However, this changes what our survey prediction system is really doing. Without the anchor, THESEUS is a true bottom-up synthetic poll, but it misses key information about the world and leads to substantially biased predictions. With the attitudinal anchors, however, it becomes a hybrid that blends agent-level reasoning with a top-down population forecast. Both versions are useful, but they answer different methodological questions.
Other changes were less useful. GPT-5.4 and GPT-5.4-mini performed roughly equally, trading accuracy on some questions with others. We also tried a two-model GPT/Claude ensemble, but it left overall error essentially unchanged, suggesting that the remaining biases are shared across model families. We also tried feeding current news directly into the agent prompt, which significantly backfired on most questions: agents treated the research brief and inferred national population distribution as instructions for how to answer for every agent and converged toward it, flattening the individual-level variation the architecture was designed to capture.
4. Discussion
The bottom line from four studies
The results of this latest study are more optimistic than those of our first three studies, but only in a narrow sense.
Synthetic sampling may have a genuine use case in replicating topline responses to polarized and frequently polled questions. On the generic ballot and Trump approval, THESEUS approaches the sampling-noise floor of a real n=1,000 poll. For those specific questions, the technique is genuinely competitive with traditional surveys. Yet, we have plenty of survey toplines for this metric already, complicating whether the response generation is adding information anyone could not glean from reading the latest reporting on political polls.
Outside that use case, it appears that factors inherent to LLM-powered response generation limit accuracy. Policy tradeoffs, institutional questions, post-training events, and topics with weak partisan signal are all hard for models to approximate. No prompt, model upgrade, calibration step, or ensemble eliminated that gap.
Further gains in accuracy may come from better synthetic population generation, more sophisticated world models, or a separate opinion-formation stage that explicitly predicts non-attitudes. But the key distinction should remain front and center: polling, especially political polling, is not an artificial endeavor, but a human one. Synthetic “samples” are predictions of behavior — just like other model-driven techniques like multilevel regression and poststratification or synthetic area estimation— not measurements of public opinion.
Synthetic opinion research may yet have value. But, as has always been the case with technology evolutions in the history of survey research, the burden of proof is on those new practitioners (trying to sell us new technologies) that their work is accurately capturing human behavior. And the research presented here suggests that professionals should approach such new technology with skepticism.
Appendix A: Imputation and accuracy (by crosstab) for different agent sample sizes
Unlike for real surveys, increasing the sample size of LLM-generated respondents has no impact on imputation accuracy. Increasing the agent pool from 500 to 5,000 barely moves error — national topline MAE drifts from 6.8 to 6.7 points, and every demographic cut flattens out within a fraction of a point of where it started.
The partisan breakdown (in Figure A1 below) sits stubbornly around 11 points across the full range, race lands around 7.5, and age and education both park near 7.2. The lines are essentially horizontal, which is the diagnostic point: residual error here is systematic, not sampling-driven. Adding agents shrinks Monte Carlo noise, but it cannot shrink the bias the LLM and the imputation step put into each agent — that floor is what these curves are flatlining against.
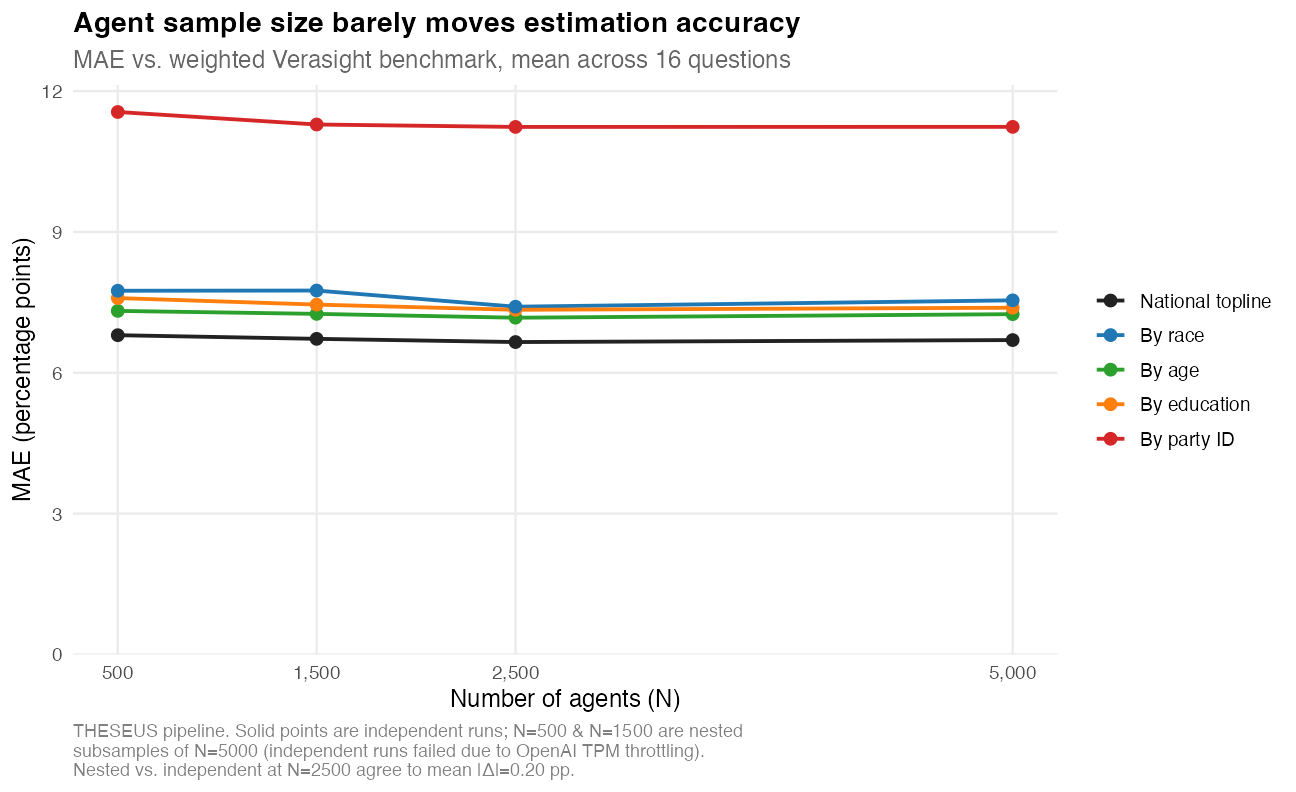
The practical implication is that scaling up agent counts is the wrong lever for improving accuracy. A 10x increase in API spend buys roughly a tenth of a percentage point of topline MAE and nothing meaningful for partisan subgroups. Improvements have to come from upstream of N — better attitude imputation, anchor calibration, or modeled response generation — not from running more agents through the same pipeline.
Appendix B: Full LLM prompts
An example LLM prompt for one agent is as such:
Message 1 — system
You are a research participant answering questions about your views and experiences.
Message 2 — user (Session 1: background interview)
# Background interview record — Agent ACS_2020GQ0162353_1
The following responses were recorded during an initial background interview. Treat these as this participant's established identity and beliefs when answering any subsequent questions.
## Demographics
Q: How old are you?
A: I am 45 to 64 years old.
Q: What is your gender?
A: Male.
Q: What is your racial or ethnic background?
A: Black or African American.
Q: What is the highest level of education you have completed?
A: I have a high school diploma or less.
Q: Roughly what is your annual household income before taxes?
A: less than $25,000.
Q: What state do you live in?
A: South Carolina. I live in the South. I live in a metropolitan area.
## Political views and attitudes
Q: Generally speaking, do you think of yourself as a Democrat, a Republican, or an Independent?
A: Independent
Q: In general, how would you describe your own political viewpoint?
A: Very liberal
Q: In the 2024 presidential election, who did you vote for?
A: I did not vote in the 2024 election
Q: Thinking about your own personal finances, how would you say you and your family are doing compared to this point a year ago?
A: Worse
Q: Where do you primarily get your political news?
A: Network or local TV news
Message 3 — assistant (background-interview acknowledgement)
Thank you for completing the background interview. Your responses have been recorded.
Message 4 — user (multi-question Verbalized Sampling prompt)
Please answer each of the following survey questions AS THIS PARTICIPANT.
Before answering, think step by step about how this person's profile shapes their views:
1. Start with their party identification and ideology — what baseline positions does this imply?
2. Consider their 2024 vote choice — does it confirm or complicate the partisan signal?
3. Factor in their demographics (age, education, income, employment, community) — how might these modify their positions on specific issues?
4. Consider their engagement level and news consumption — how informed and opinionated are they likely to be? Low-engagement respondents (those who don't follow news closely, have lower education, or are younger) are much more likely to say 'Don't know' on policy and institutional questions.
5. For each question, ask: is this something this person has likely thought about before? Core political questions (presidential approval, party vote) are familiar to nearly everyone. But policy specifics (DC statehood, budget tradeoffs, third-party reform, deportation policy) are topics many Americans have never considered — for those questions, 'Don't know' should often be the MOST probable response for low-engagement respondents.
Then, for each question, list exactly K candidate responses (where K = number of options for that question), ordered from most to least probable. Assign probability weights that sum to exactly 1.0 per question.
IMPORTANT — calibrate 'Don't know' realistically:
- High-salience questions (presidential approval, vote choice): DK = 2-5%
- Medium-salience questions (economy, immigration direction): DK = 8-15%
- Low-salience policy questions (statehood, institutional reform, budget details, third-party viability): DK = 18-35%. Most people have not formed an opinion on these.
- Awareness questions ('how much have you heard about X'): DK = 2-5% (people know whether they've heard of something)
Do NOT default to having an opinion. Real survey respondents frequently say 'Don't know' — this is not a sign of ignorance but an accurate reflection of how most people engage with politics.
Question "generic_ballot" (3 options):
If the 2026 general election for Congress were held today, which party's candidate would you be more likely to vote for in your local Congressional district?
Options:
"D": "The Democratic Party candidate"
"R": "The Republican Party candidate"
"DK": "Don't know"
Question "trump_approval" (3 options):
Do you approve or disapprove of the way Donald Trump is handling his job as president?
Options:
"approve": "Approve"
"disapprove": "Disapprove"
"dk": "Don't know"
Question "iran_taxpayer" (3 options):
As you may know, the United States has launched military operations against Iran. Do you think the U.S. military operation in Iran is a good use or bad use of taxpayer dollars?
Options:
"good": "Good use of taxpayer dollars"
"bad": "Bad use of taxpayer dollars"
"dk": "Don't know"
Question "country_direction" (4 options):
Which best describes your view of the direction the country is headed?
Options:
"going_well": "Things are going well in America and no major changes are needed"
"could_better": "Things could be going better"
"going_poorly": "Things are going poorly, and major, disruptive changes are needed"
"dk": "Don't know"
Question "jan_venezuela_aware" (5 options):
On January 3rd, the United States carried out airstrikes in Venezuela and captured President Nicolas Maduro, who now faces drug trafficking and conspiracy charges in a U.S. court. The military action was not authorized by Congress. How much have you seen, read, or heard about the U.S. military strike in Venezuela?
Options:
"great_deal": "A great deal"
"some": "Some"
"not_much": "Not much"
"nothing": "Nothing at all"
"dk": "Don't know"
Question "jan_vote_likelihood" (5 options):
If the 2026 general election for Congress were held today, how likely would you be to vote?
Options:
"def_vote": "Would definitely vote"
"prob_vote": "Would probably vote"
"prob_not": "Probably would not vote"
"def_not": "Definitely would not vote"
"dk": "Don't know"
Question "nov_tax_corps" (6 options):
Would you support or oppose Congress increasing taxes for corporations and families making more than $400,000 per year as a way to expand social services?
Options:
"str_support": "Strongly support"
"smw_support": "Somewhat support"
"neutral": "Neutral"
"smw_oppose": "Somewhat oppose"
"str_oppose": "Strongly oppose"
"dk": "Don't know"
Question "nov_more_parties" (3 options):
Would you support changes to the way Congressional elections are run to increase the number of parties in the US Congress?
Options:
"yes": "Yes, I want more parties"
"no": "No, I am happy with the current parties"
"dk": "Don't know"
Question "nov_third_party" (5 options):
If a candidate from a new political party were on your ballot for Congress in 2026, and had just as good a chance of winning as the Democratic and Republican candidates, how likely would you be to consider voting for them?
Options:
"very_likely": "Very likely"
"somewhat_likely": "Somewhat likely"
"not_too_likely": "Not too likely"
"not_at_all": "Not at all likely"
"dk": "Don't know"
Question "jun_highskill_immig" (5 options):
The 'Abundance Agenda' includes attracting more high-skill immigrants (such as scientists, engineers, and doctors) from foreign countries to increase American innovation and ease worker shortages. Do you support or oppose policies to make immigration for high-skill workers easier?
Options:
"str_support": "Strongly support"
"smw_support": "Somewhat support"
"smw_oppose": "Somewhat oppose"
"str_oppose": "Strongly oppose"
"dk": "Don't know"
Question "may_budget_tradeoff" (4 options):
Republicans in Congress have proposed a budget that would make Donald Trump's 2017 tax cuts on corporations and middle-class families permanent, and increase military spending, but require the U.S. to cut hundreds of billions of dollars in spending on social programs. Thinking about the options Congress has, would you rather see it...
Options:
"cut_spending": "Decrease spending on social services so Congress can extend Trump's tax cuts"
"extend_deficit": "Extend tax cuts but keep spending constant, increasing the deficit"
"raise_taxes": "Raise taxes on corporations and high-income families to keep spending and pay down the deficit"
"dk": "Don't know"
Question "aug_tariffs" (5 options):
As you may know, the U.S. has recently increased tariffs on a range of imports. Do you approve or disapprove of these new tariffs?
Options:
"str_approve": "Strongly approve"
"smw_approve": "Somewhat approve"
"smw_disapprove": "Somewhat disapprove"
"str_disapprove": "Strongly disapprove"
"dk": "Don't know"
Question "mar_pardons" (3 options):
Do you approve or disapprove of President Trump's decision to pardon individuals convicted for their participation in the January 6th attack on the U.S. Capitol?
Options:
"approve": "Approve"
"disapprove": "Disapprove"
"dk": "Don't know"
Question "may_deportation" (3 options):
President Trump campaigned on a promise to deport all immigrants who entered the U.S. illegally back to their home countries. Do you support or oppose deporting all undocumented immigrants, regardless of whether they have committed other crimes or how long they have been in the U.S.?
Options:
"support": "Support deporting all undocumented immigrants"
"oppose": "Oppose deporting all undocumented immigrants"
"dk": "Don't know"
Question "jan_single_payer" (5 options):
Do you think the United States should adopt a single-payer healthcare system, where the government provides health insurance for all Americans?
Options:
"yes_def": "Yes, definitely"
"yes_prob": "Yes, probably"
"not_sure": "Not sure"
"no_prob": "No, probably not"
"no_def": "No, definitely not"
Question "feb_dc_statehood" (3 options):
Would you support or oppose making Washington, DC its own state?
Options:
"support": "Support"
"oppose": "Oppose"
"dk": "Not sure"
First write a brief analysis of this respondent's likely orientation (2-3 sentences). Then provide the JSON object keyed by question ID.
Example format:
{
"generic_ballot": [{"response": "D", "probability": 0.XX}, {"response": "R", "probability": 0.XX}, ...],
...
}
Appendix C: Question wording and imputation performance
1. Venezuela awareness — MAE 12.8 pp
ID: jan_venezuela_aware
On January 3rd, the United States carried out airstrikes in Venezuela and captured President Nicolas Maduro, who now faces drug trafficking and conspiracy charges in a U.S. court. The military action was not authorized by Congress. How much have you seen, read, or heard about the U.S. military strike in Venezuela?
- A great deal
- Some
- Not much
- Nothing at all
- Don't know
2. Budget tradeoff — MAE 11.0 pp
ID: may_budget_tradeoff
Republicans in Congress have proposed a budget that would make Donald Trump's 2017 tax cuts on corporations and middle-class families permanent, and increase military spending, but require the U.S. to cut hundreds of billions of dollars in spending on social programs. Thinking about the options Congress has, would you rather see it…
- Decrease spending on social services so Congress can extend Trump's tax cuts
- Extend tax cuts but keep spending constant, increasing the deficit
- Raise taxes on corporations and high-income families to keep spending and pay down the deficit
- Don't know
3. Third-party candidate — MAE 10.1 pp
ID: nov_third_party
If a candidate from a new political party were on your ballot for Congress in 2026, and had just as good a chance of winning as the Democratic and Republican candidates, how likely would you be to consider voting for them?
- Very likely
- Somewhat likely
- Not too likely
- Not at all likely
- Don't know
4. Deportation — MAE 9.2 pp
ID: may_deportation
President Trump campaigned on a promise to deport all immigrants who entered the U.S. illegally back to their home countries. Do you support or oppose deporting all undocumented immigrants, regardless of whether they have committed other crimes or how long they have been in the U.S.?
- Support deporting all undocumented immigrants
- Oppose deporting all undocumented immigrants
- Don't know
5. DC statehood — MAE 8.8 pp
ID: feb_dc_statehood
Would you support or oppose making Washington, DC its own state?
- Support
- Oppose
- Not sure
6. Country direction — MAE 7.8 pp
ID: country_direction
Which best describes your view of the direction the country is headed?
- Things are going well in America and no major changes are needed
- Things could be going better
- Things are going poorly, and major, disruptive changes are needed
- Don't know
7. Single-payer health — MAE 6.5 pp
ID: jan_single_payer
Do you think the United States should adopt a single-payer healthcare system, where the government provides health insurance for all Americans?
- Yes, definitely
- Yes, probably
- Not sure
- No, probably not
- No, definitely not
8. Tax corporations — MAE 6.1 pp
ID: nov_tax_corps
Would you support or oppose Congress increasing taxes for corporations and families making more than $400,000 per year as a way to expand social services?
- Strongly support
- Somewhat support
- Neutral
- Somewhat oppose
- Strongly oppose
- Don't know
9. Jan. 6 pardons — MAE 5.4 pp
ID: mar_pardons
Do you approve or disapprove of President Trump's decision to pardon individuals convicted for their participation in the January 6th attack on the U.S. Capitol?
- Approve
- Disapprove
- Don't know
10. Tariffs — MAE 5.3 pp
ID: aug_tariffs
As you may know, the U.S. has recently increased tariffs on a range of imports. Do you approve or disapprove of these new tariffs?
- Strongly approve
- Somewhat approve
- Somewhat disapprove
- Strongly disapprove
- Don't know
11. More parties — MAE 5.2 pp
ID: nov_more_parties
Would you support changes to the way Congressional elections are run to increase the number of parties in the US Congress?
- Yes, I want more parties
- No, I am happy with the current parties
- Don't know
12. Iran operations — MAE 4.6 pp
ID: iran_taxpayer
As you may know, the United States has launched military operations against Iran. Do you think the U.S. military operation in Iran is a good use or bad use of taxpayer dollars?
- Good use of taxpayer dollars
- Bad use of taxpayer dollars
- Don't know
13. Vote likelihood — MAE 4.3 pp
ID: jan_vote_likelihood
If the 2026 general election for Congress were held today, how likely would you be to vote?
- Would definitely vote
- Would probably vote
- Probably would not vote
- Definitely would not vote
- Don't know
14. High-skill immigration — MAE 4.1 pp
ID: jun_highskill_immig
The "Abundance Agenda" includes attracting more high-skill immigrants (such as scientists, engineers, and doctors) from foreign countries to increase American innovation and ease worker shortages. Do you support or oppose policies to make immigration for high-skill workers easier?
- Strongly support
- Somewhat support
- Somewhat oppose
- Strongly oppose
- Don't know
15. Trump approval — MAE 2.1 pp
ID: trump_approval
Do you approve or disapprove of the way Donald Trump is handling his job as president?
- Approve
- Disapprove
- Don't know
16. Generic ballot — MAE 1.8 pp
ID: generic_ballot
If the 2026 general election for Congress were held today, which party's candidate would you be more likely to vote for in your local Congressional district?
- The Democratic Party candidate
- The Republican Party candidate
- Don't know