.avif)
Recommended Citation
Morris, Elliott G. 2025. “Your Polls on ChatGPT.” Verasight White Paper Series. https://www.verasight.io/reports/synthetic-sampling
1. Goal
In mid-2025, survey researchers are increasingly entertaining — and some startups are achieving high valuations for — the use of artificial intelligence (AI) models as replacements for human respondents. A popular method is to give a large language model (LLM) a set of demographic and political traits belonging to a real, human person, and ask the model how that person would respond on a set of survey questions.
Many have been quick to herald this approach. During the 2024 election, one journal article explored using an LLM chat bot to fill in survey responses for the previous (2020) presidential race. This analysis found the LLM could replicate the results of the 2020 race with a high correlation (>0.9) to the actual results at the state level, and predicted the right winner in the electoral college (Yu et al. 2024).
Such an approach could in theory be incredibly useful for survey researchers – especially as the cost of reaching real people via traditional phone-based methods continues to rise. Such techniques also promise to speed up the process of polling, and to explore new ways of testing questionnaires, data pipelines, etc. The claims of high accuracy, then, are worth carefully vetting.
In this analysis we seek to determine the accuracy of so-called “synthetic” polling data generated by LLMs along four dimensions:
- Topline result: Can the model get population percentages correct?
- Crosstabs: Can the model recover subgroups attitudes?
- Person-level congruence: When someone tells us they “strongly approve” of Donald Trump, does the model give the same response?
- Out-of-sample data: How does the model perform on questions that aren’t in a LLM’s training data?
2. Method
We will answer our question by assessing how closely the responses generated by several large language models match actual survey data from a poll of a representative sample of 1,500 American adults conducted on Verasight’s online panel in June 2025. First, we will use a LLM to generate a set of fake responses to two poll questions — a "synthetic sample” — using the demographic and political variables for 1,500 people from our real survey. Then, we will compare the marginal and crosstab-level percentages for those two questions in the synthetic sample and the actual sample. Finally, we will repeat the analysis with one question the LLM should have little to know direct knowledge of in its training data, due to its knowledge cutoff predating the issue in question, thereby creating a true out-of-sample predictive task for the AI.
2.1 Model prompting procedure
Following several existing studies of LLM-generated poling data (Bisbee et al. 2024; Argyle et al. 2024) we generate a synthetic sample by repeatedly prompting a large language model, via its API, with three pieces of information: (1) the “persona” of a real person, (2) the question we would like the model to ask, and (3) the response options for those questions.
The prompt to our LLM contains the following instructions:
“ Your job is now to act as a substitute for a human respondent.
I am going to give you a persona to adopt, a question to answer, and a set of responses to answer with.
You must answer the question in the way you think the given persona would answer, using only one of the given responses, verbatim.
Here is your persona: <persona>
Here is the question: <question>
Here are your answer options: <options>
Now please return just the text of the response to that question that you think is most likely given the question and persona.”
We create a persona for each of the 1,500 people in our poll by filling in the following text with their real characteristics:
You are a [age] year old [gender] of [hisp/race] race/ethnicity.
Your education level is [edu], and you make [$] US dollars per year.
You live in [state] in the [region] region of the United States.
In terms of political parties, you identify more as a [ideology] and vote more with the [party] party.
So, eg, an example persona might read:
You are a 61-year old woman of white race/ethnicity.
Your education level is Bachelor’s Degree, and you make 50,000-75,000 US dollars per year.
You live in Florida in the South East region of the United States.
In terms of political parties, you identify more as a moderate and vote more with the Independent party.
Next, we add a question. Given the political climate today, one popular question is: “"Do you approve or disapprove of the way Donald Trump is handling his job as president?"
In our real survey, respondents are given the following response options: “Strongly approve | Somewhat approve | Somewhat disapprove | Strongly disapprove | Don't know/not sure"
Mimicking a real survey, we randomize the order (strongly approve to strongly disapprove or strongly disapprove to strongly approve) of these responses in our LLM prompts.
We repeatedly prompt the model with the personas of each of our respondents, and get back a list of 1,500 responses to the Trump approval question that we can analyze for a match.
One note on LLMs: different providers offer different models — trained in different ways and containing different systems for “thinking” or external research — for users to interface with. For this analysis, we tried five models from OpenAI, and found GPT 4o-mini performed best¹. Where possible, we present results from all models, to underscore the importance that LLM training procedure (which is outside the control of the survey researcher) makes.
2.2 Quantities of interest
With our dataset of 1,500 LLM-generated responses (and 1,500 real responses), we can calculate several statistics to assess the accuracy of a synthetic sample:
- First, we calculate the percentage of the population in each response category, given the responses from the LLM and humans. Both samples were weighted identically. We compare the LLM proportions to the “true” proportions in the human sample.
- Second, we calculate percentages in each response category for a set of qualitatively important subgroups, including African Americans and young people.
- Finally, we see how the LLM does at the individual level: When someone says they “strongly approve” of Donald Trump, does the model predict the same response?
We calculate these statistics for three questions:
- Trump’s approval rating
- The “generic congressional ballot,” a question which asks people which party they want to see control Congress after the next elections (in 2026)
- And whether the respondent supports limiting the ability of cities to pass restrictive local zoning laws.
The last question arose from a debate over the so-called “Abundance Agenda,” which includes a proposal for Democratic Party politicians to increase the supply of housing and improve U.S. infrastructure. The full question wording and response options are as follows:
- Question: "As part of the Abundance Agenda, some policymakers propose limiting the ability of cities to pass local zoning rules, which prevent developers from building dense housing such as townhomes and apartments. Repealing restrictive zoning laws would allow more apartments and homes to be built in cities and suburbs, but take some control away from the local community. Would you prefer limiting local zoning rules to build more homes, or allowing local zoning rules to stay unchanged?",
- Response options: "Limit local zoning rules to build more homes,” “Keep local zoning rules unchanged,” “Don't know/not sure"
3. Results + Figures: LLMs Do a Poor Job Replicating Survey Results
This section is broken down into topline accuracy, crosstab accuracy, respondent-level congruence, and and accuracy on out-of-sample questions:
3.1 Topline accuracy
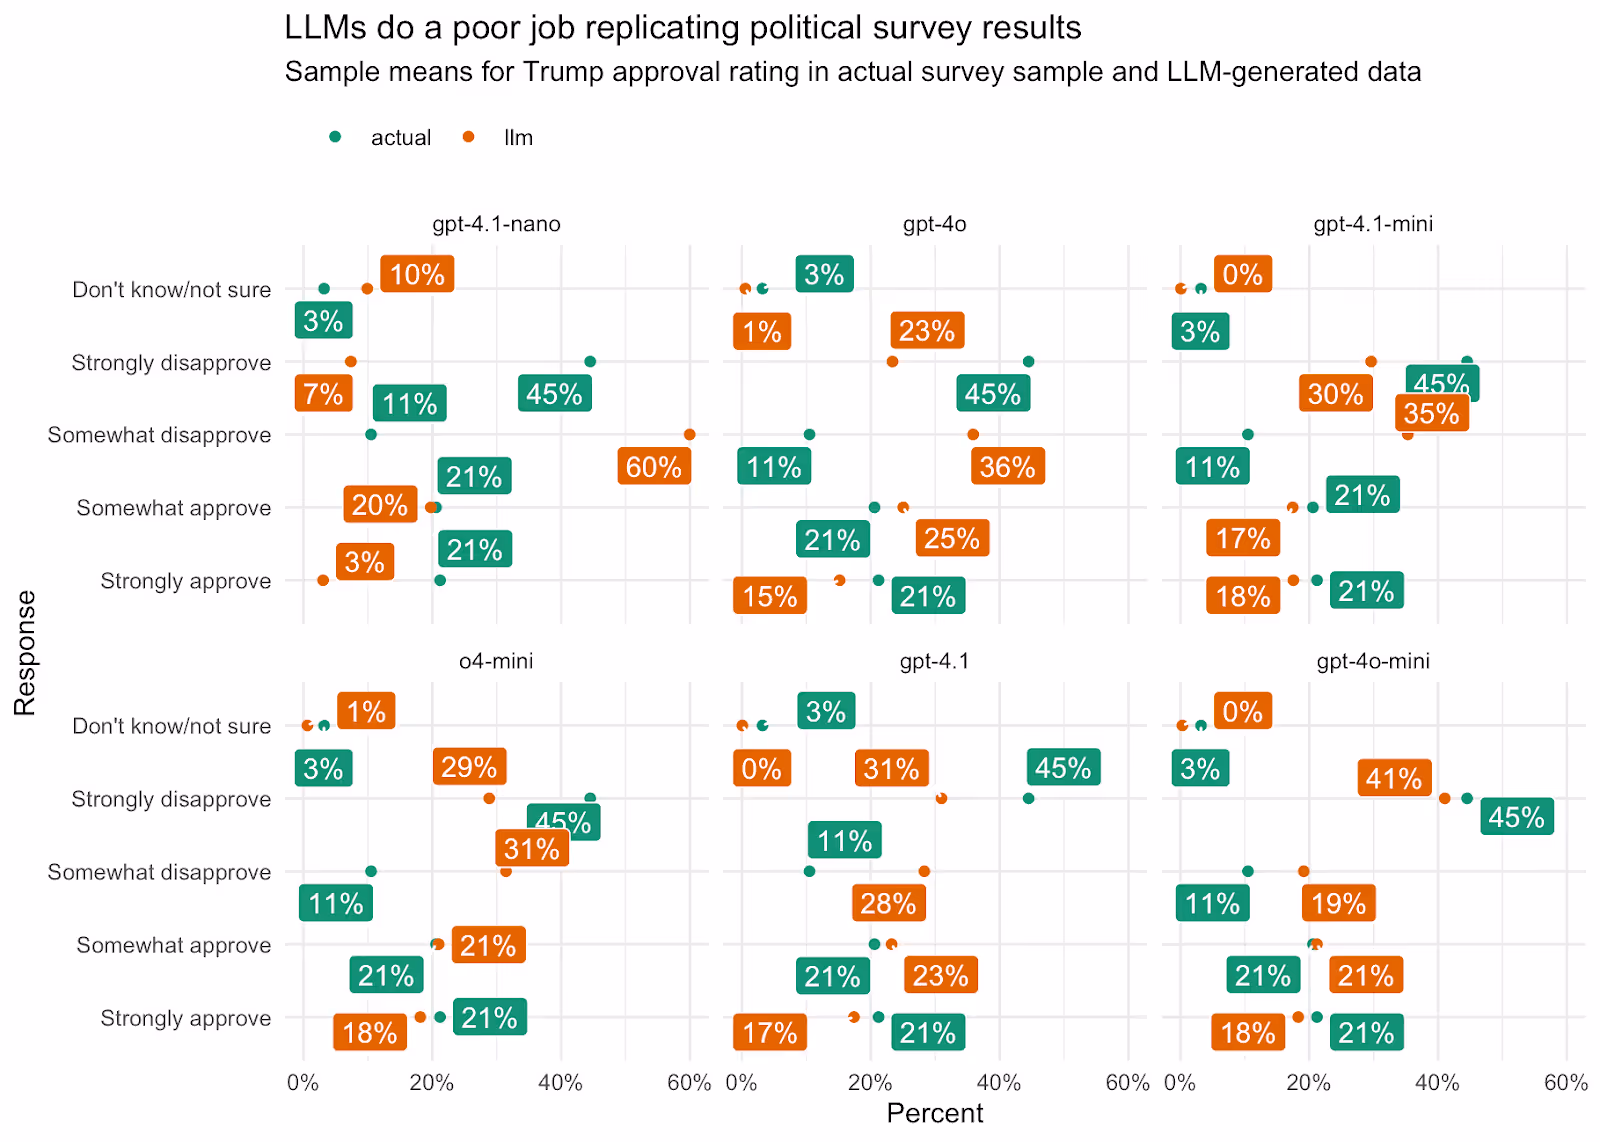
Overall, we found substantial variation across LLM models, with an average absolute error rate that ranged from 4 percentage points to 23 percentage points. This means that across the population percentages for each response option (“strongly disapprove,” “somewhat disapprove,” etc) the “attitudes” of the best-performing synthetic sample were an average of 4 points off from the true human sample. Even with this accuracy, the best performing LLM significantly overestimates disapproval of Trump, by underestimating strong disapproval by 4 percentage points and overestimating somewhat disapproval by 8 percentage points. When it comes to crafting narratives about politics and public opinion, even errors of 4% are consequential.
On topline distributions: 39% of the synthetic respondents in our best-performing model) approve of Donald Trump, versus 42% in the actual data; Trump gets a 55% disapproval rating in our actual data, but 60% in the LLM sample. The most consistent bias is on "don't know", which LLMs very rarely generate (rounding to 0% of the sample) but gets picked fairly often in public opinion polls (3% for Trump approval).
As mentioned, these results are for the best performing model in our analysis. The graphic below compares the means of human and LLM responses for 6 different models from the LLM company OpenAI. Note that the LLMs hardly ever assigned individuals a response of “don’t know” on Trump approval, despite 3% of our sample picking that option. (3% may seem low, but substantively this amounts to about 8 million U.S. adults).
Figure 1
3.2 Crosstab accuracy
Using the polling data generated by our best-performing LLM (GPT 4o-mini) on overall Trump approval, we can also compare crosstab level results for a range of demographic groups. Below we select a few key groups for illustration:
- Black: Trump disapproval 15 points off (LLM 85%, actual 70%); Hispanic, 4 points off (62 vs 66); Other race 20 points off (60% actual, 40% LLM)
- Young people 8 points off on disapproval (68% actual disapprove vs 76% LLM); 30-44 is 10 points off on approve, 37% actual vs 47% in the data
The graphic below visualizes the difference between the modeled percentage and true percentage of each group giving each response category, for each race/ethnic and age group in our data.
Figure 2

While most differences are less than 10-15%, even errors of that magnitude are a problem for anything but the most rudimentary public opinion research. Especially for smaller groups, synthetic data is close to useless for crosstabs. Consider that in a context where a researcher is selecting a (non-synthetic) provider of survey data, they would not select a source knowing it may over- or under-estimate the true subgroup population proportion by 30 points!
The average absolute difference between the population proportion and LLM proportion for these demographic subgroups is 8 percentage points.
Our findings on subgroup representativeness add to a growing body of literature (Santurkar et al. 2023) that raises fundamental questions about the ability of LLMs to capture opinions of minority groups. Given that these models are inherently biased toward the average respondent (next-token prediction is a product of correlations between all observed tokens) this is unsurprising.
3.3 Respondent level
While the most accurate LLM above was able to come somewhat close to population means on average, the higher error rates when analyzing demographic groups suggest the potential for greater error at the respondent level. This increased error would occur because the respondent level error sometimes cancels out in the aggregate.
For example, in our Trump approval data, roughly 20% of people who said they opposed Trump in real life were predicted by the LLM to support him. Among disapprovers, the error rate was about 20% in the opposite direction.
When we break Trump approval out for strength of approve/disapprove, accuracy falls dramatically — with the best-performing model missing the share of adults who strongly disapprove of Trump by 10 percentage points.
Figure 3
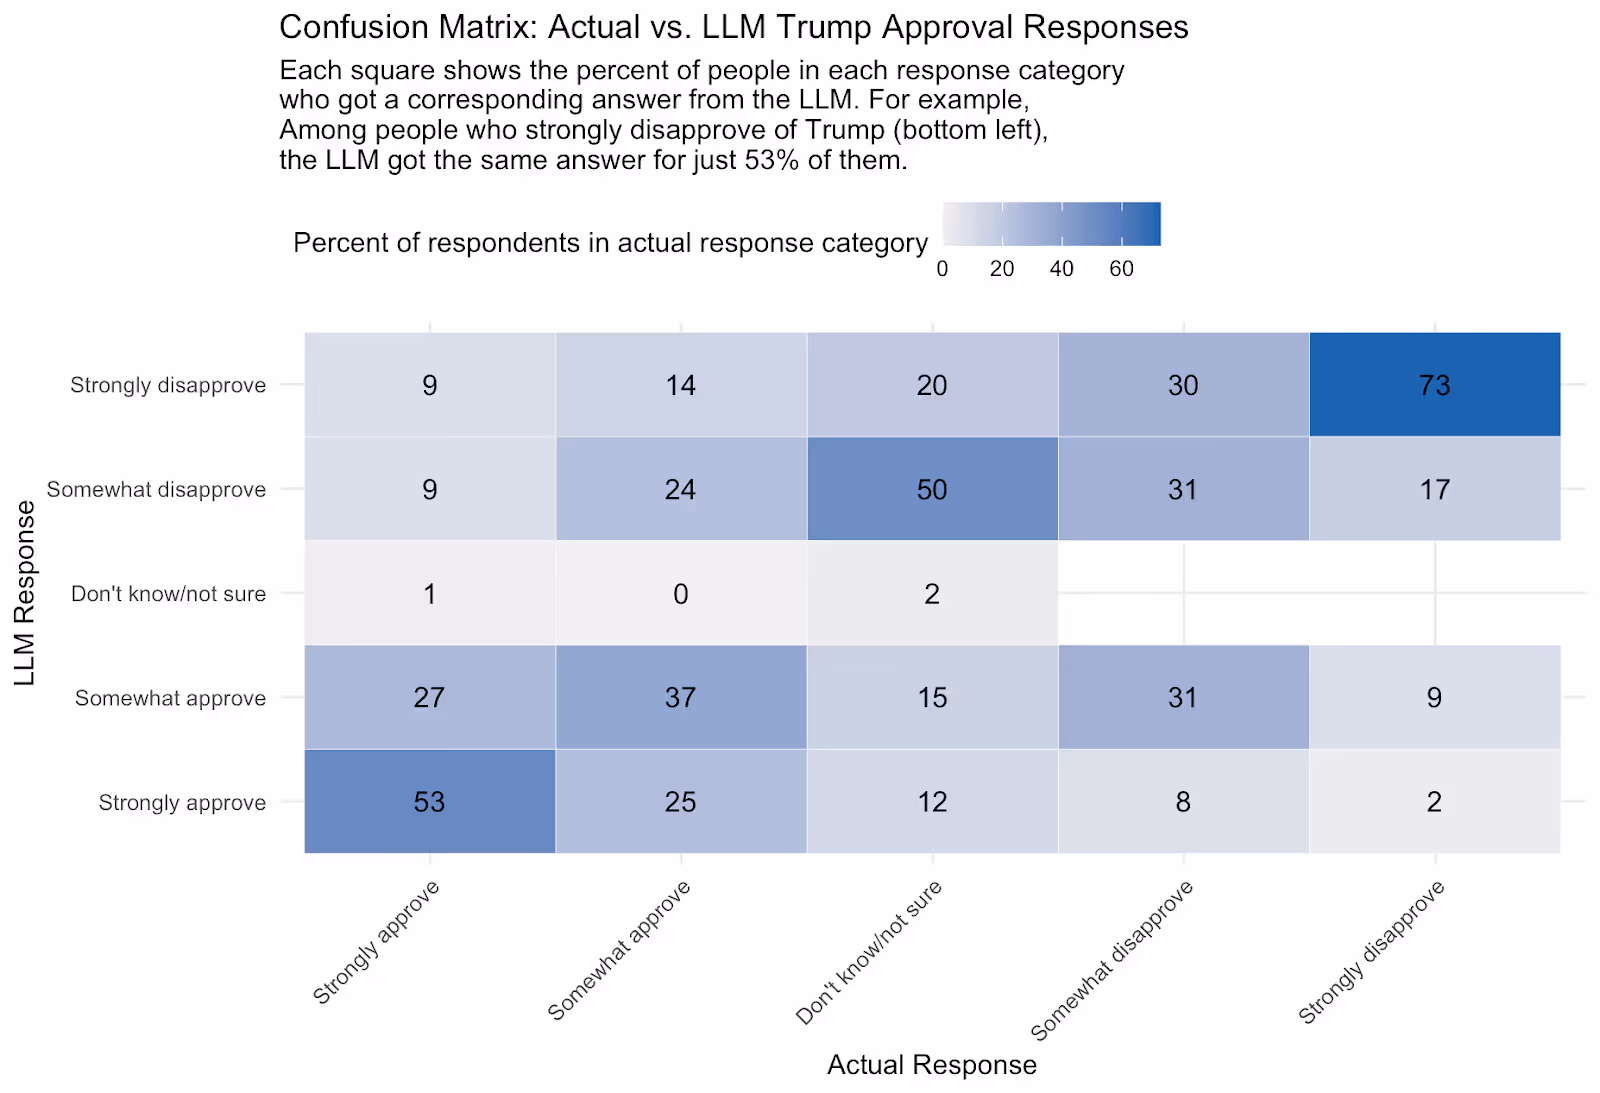
While it may seem promising to get, eg, a 74% match rate for people who “strongly disapprove” of Trump, error rates of even 20% would compound to create large distortions in analysis. This randomness would also decrease the predictiveness of certain demographic traits on outcomes (eg, age and Trump approval), which means results based on synthetic data would contradict established findings from social science.
3.4 Out-of-sample questions
Finally, when we move beyond the information in the LLM’s training data — so, any human knowledge published after September 2024, the knowledge cutoff for OpenAI’s 4o-mini model — we start to see even larger differences between LLM and actual response percentages. Kim and Lee (2024) find that LLM performance predicting human responses to such out-of-sample questions is very low, for example reporting that “For predicting the population proportion, our model with the 3% margin of error can predict only about 12% of true survey responses in the unasked opinion prediction task.”
This issue is compounded if a researcher selects a topic without clear partisan lines divisions, as is common in market research.
In our question on abundance, the actual sample proportion and LLM proportions are as such:
- Actual support, 28% for "Limit local zoning rules to build more homes" and 43% again, 29% don't know
- LLM result, 59% for limiting zoning rules, 41% against, and 0% don't know
In this case not only does the LLM swap the leading position, it exaggerates percentages for both responses. The bias against “don’t know” is particularly striking here, when nearly a third of the population picked this option but no LLM response gave a DK/not sure.
3.5 Prompting enhancements
An additional technique becoming more common in the academic literagture is to provide the LLM with additional context about a expected response pattern to increase performance. Researchers can provide one example for the expected response pattern, for example (“one-shot” encoding) or multiple (“few-shot”) to help the model “figure out” the expected response format for a task.
Some social-science researchers use a similar technique to provide additional information to the LLM, in theory aiding in prediction tasks. For example, Chu et al. 2023 report a dramatic increase in prediction of public opinion after passing the text of various news sources to the LLM. The correlation of their answers to real data is, however, still rather low at 0.4. That is an improvement from a tabula rasa prediction, but again, not helpful accuracy for public opinion research.
We tested an approach to providing additional context to the LLM with only a slight modification of our prompting pipeline. Instead of just providing instructions and the target persona in the system prompt sent to the model, we first included a random selection of 50 personas created from real individuals and their responses to the target question. Our theory is that adding this information to the AI’s context window may increase its ability to predict responses given patterns in joint distributions not available in its training data.
This technique did not deliver the desired results. In fact, it degraded the predictive accuracy of our synthetic sample by a significant amount. The correlation between crosstab-level opinion fell from 0.93 to 0.81, and the error matching population proportions increased from 4% to 6% for our best-performing model — a 50% increase in error.
4. Conclusion: LLMs Not Accurate Replacements For Human Respondents
Overall, the performance of our “synthetic sample” is too poor to be useful for all of our research questions. In computing overall population proportions, the technique above produces error rates at a minimum of several percentage points, too large to tolerate in academic, political, and most market-research contexts. Further, we have demonstrated synthetic samples generate such high errors at the subgroup level that we do not trust them at all to represent key groups in the population.
The procedure may be useful in data pipelines, such as for generating fake data to test for bugs in computer programs, or establishing baselines that can be used to identify survey results that differ from expectations, but only for certain types of questions and by significant margins and not for demographic subgroups (where expected error is high).
Generally, on questions with predictable partisan patterns (such as Trump approval and Congressional vote intention) the synthetic sample can get within 5-10% of the topline distribution from an existing poll. But on questions that don't map neatly onto partisanship, the synthetic sample struggles further, and tends to polarize responses. This pattern of exaggerating polarization extends to cross-tab level analysis, especially for African American respondents, who are pushed disproportionately into left-wing ideological positions by LLMs.
The findings of this analysis suggest that the theoretical advantages of synthetic sampling — namely, cost-savings — are not worth the hit to accuracy. Not only can LLMs produce directionally wrong conclusions about what the public wants or things, but LLMs consistently underestimate uncertainty (i.e., don’t know responses) and misrepresent the perspectives of important groups in the population. Additionally, those trying to understand the relationships between demographic and other variables with specific survey questions can be further misled by synthetic data. And that is before the firm factors in the cost of building a state-of-the-art system for “collecting” a synthetic sample or considering the massive environmental costs of LLMs.
References
Argyle, L. P., Busby, E. C., Fulda, N., Gubler, J. R., Rytting, C., & Wingate, D. (2023). Out of one, many: Using language models to simulate human samples. Political Analysis, 31(3), 337–351. https://doi.org/10.1017/pan.2023.2 Cambridge University Press & Assessment
Bisbee, J., Clinton, J. D., Dorff, C., Kenkel, B., & Larson, J. M. (2024). Synthetic replacements for human survey data? The perils of large language models. Political Analysis, 32(4), 401–416. https://doi.org/10.1017/pan.2024.5 Cambridge University Press & Assessment
Chu, E., Andreas, J., Ansolabehere, S., & Roy, D. (2023). Language models trained on media diets can predict public opinion (arXiv preprint arXiv:2303.16779). https://doi.org/10.48550/arXiv.2303.16779 arXiv
Kim, J., & Lee, B. (2024). AI-augmented surveys: Leveraging large language models and surveys for opinion prediction(arXiv preprint arXiv:2305.09620). https://doi.org/10.48550/arXiv.2305.09620 arXiv
Santurkar, S., Durmus, E., Ladhak, F., Lee, C., Liang, P., & Hashimoto, T. (2023). Whose opinions do language models reflect? (arXiv preprint arXiv:2303.17548). https://doi.org/10.48550/arXiv.2303.17548
Yu, C., Weng, Z., Li, Y., Li, Z., Hu, X., & Zhao, Y. (2024, October 21). Towards more accurate US Presidential election via multi-step reasoning with large language models (Version 1) [Preprint]. arXiv. https://arxiv.org/abs/2411.03321v1