Attendees of the 2026 American Political Science Association (APSA) conference in Boston submitted 155 questions to the Verasight APSA 2026 Omnibus Survey, fielded to the Verasight Panel from September 25 to 30. Each respondent was randomly assigned to one of three modules, so every result below is based on 1,000 U.S. adults. This article covers selected results on democracy, elections, AI, and data centers. Results for all 155 questions are in the full report.
Do Americans think U.S. democracy is getting weaker?
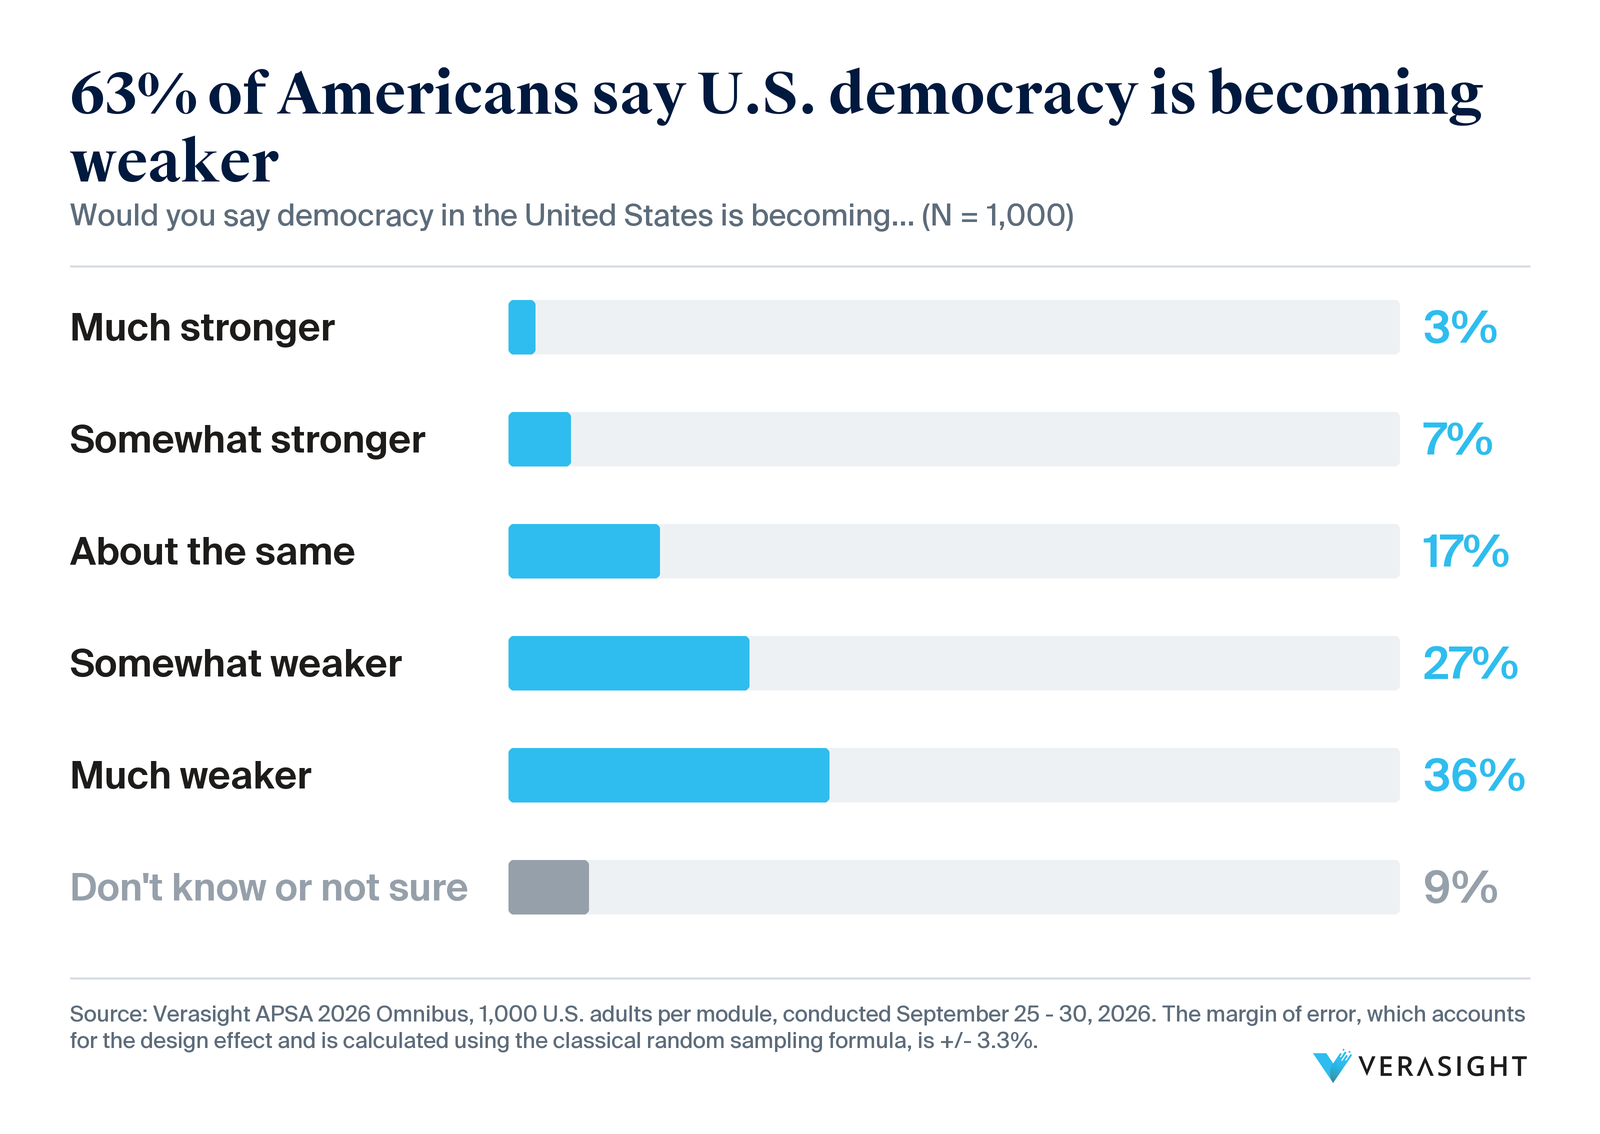
When asked whether democracy in the United States is becoming stronger, weaker, or about the same, 63% of respondents said it is becoming weaker: 27% somewhat weaker and 36% much weaker. Another 17% said it is about the same. The survey included further results on the strength of U.S. democracy:
- 43% describe government in the United States today as somewhat or very undemocratic, 32% as somewhat or very democratic, and 25% as neither.
- 76% would prefer elected officials they agree with to be civil and respectful toward those they disagree with; 7% would prefer them to be uncivil.
- Asked to choose, 66% said a revolution in America is more likely today than at any time in the past 100 years.
- 47% say all or most public officials running the government are corrupt, and 36% say some of them are.
What do Americans trust to predict who will win an election?
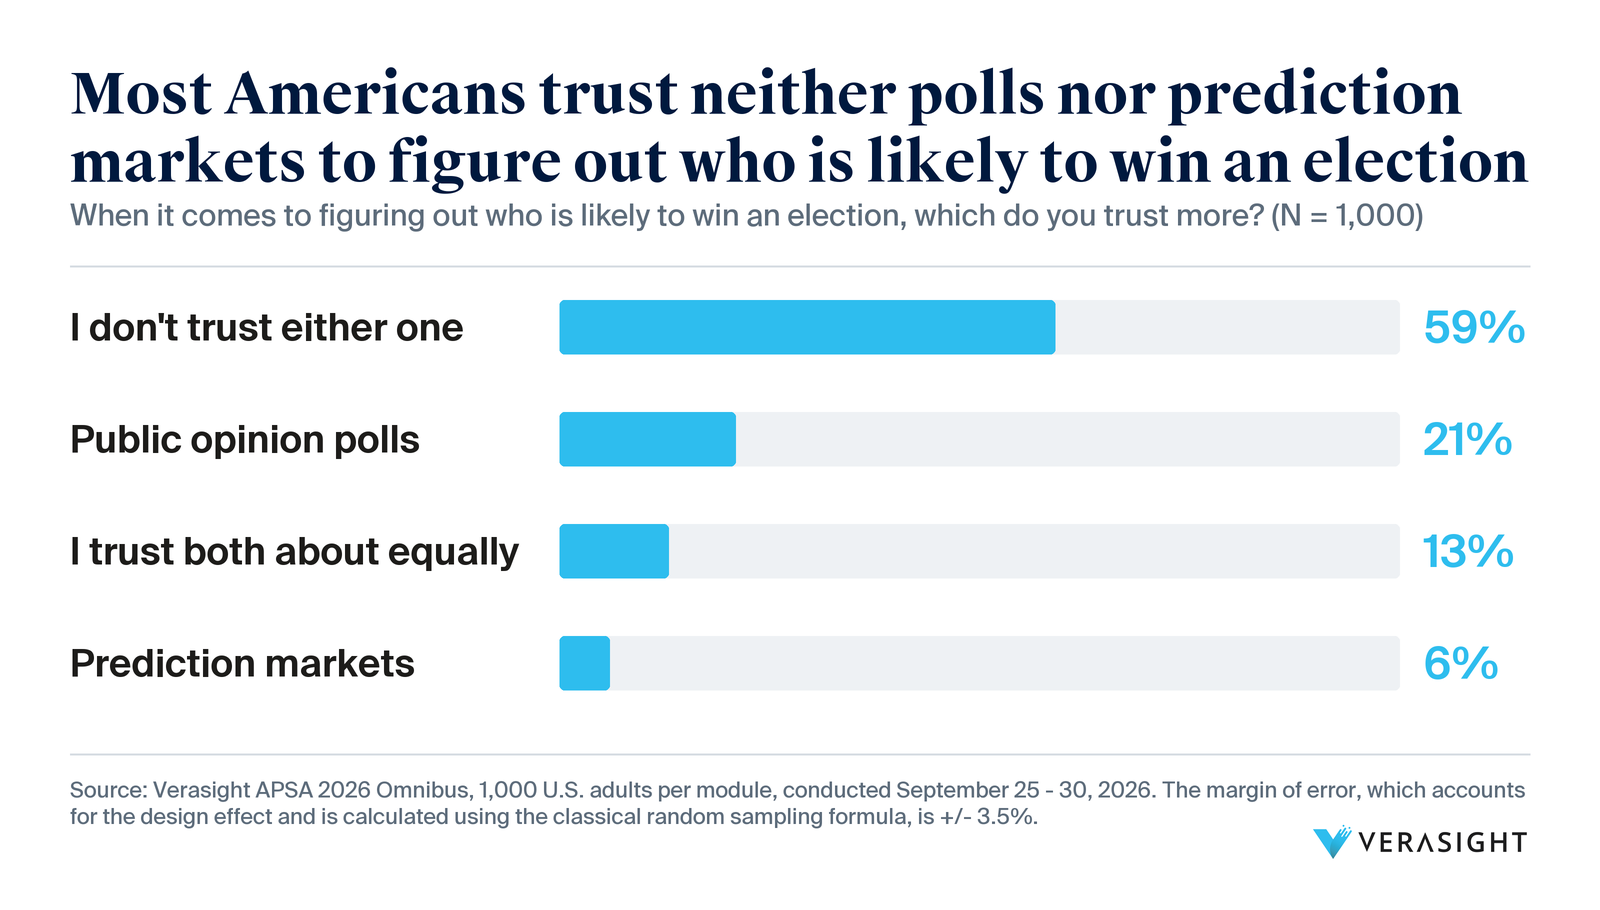
When asked whether they trust public opinion polls or prediction markets more to figure out who is likely to win an election, 59% of respondents said they trust neither. The rest split as follows:
- 21% trust polls more.
- 6% trust prediction markets more.
- 13% trust both about equally.
How are Americans using AI to follow politics?
When asked which AI interfaces, if any, they had used to learn about politics for the election, 62% of respondents said they had not used any. Among the tools listed, 27% had used ChatGPT, 20% Gemini, and 7% Grok.
On how AI should handle political information:
- If an AI chatbot chose which news sources to show them, 38% would want a mix that includes sources they disagree with, 29% would want politically balanced or centrist sources, and 6% would want sources that share their views.
- On the federal government's own use of AI, 52% lean toward the view that "AI makes too many mistakes and removes human judgment, so its use should be tightly restricted." Another 23% chose equally or neither.

How do Americans weigh the costs and benefits of data centers in their state?
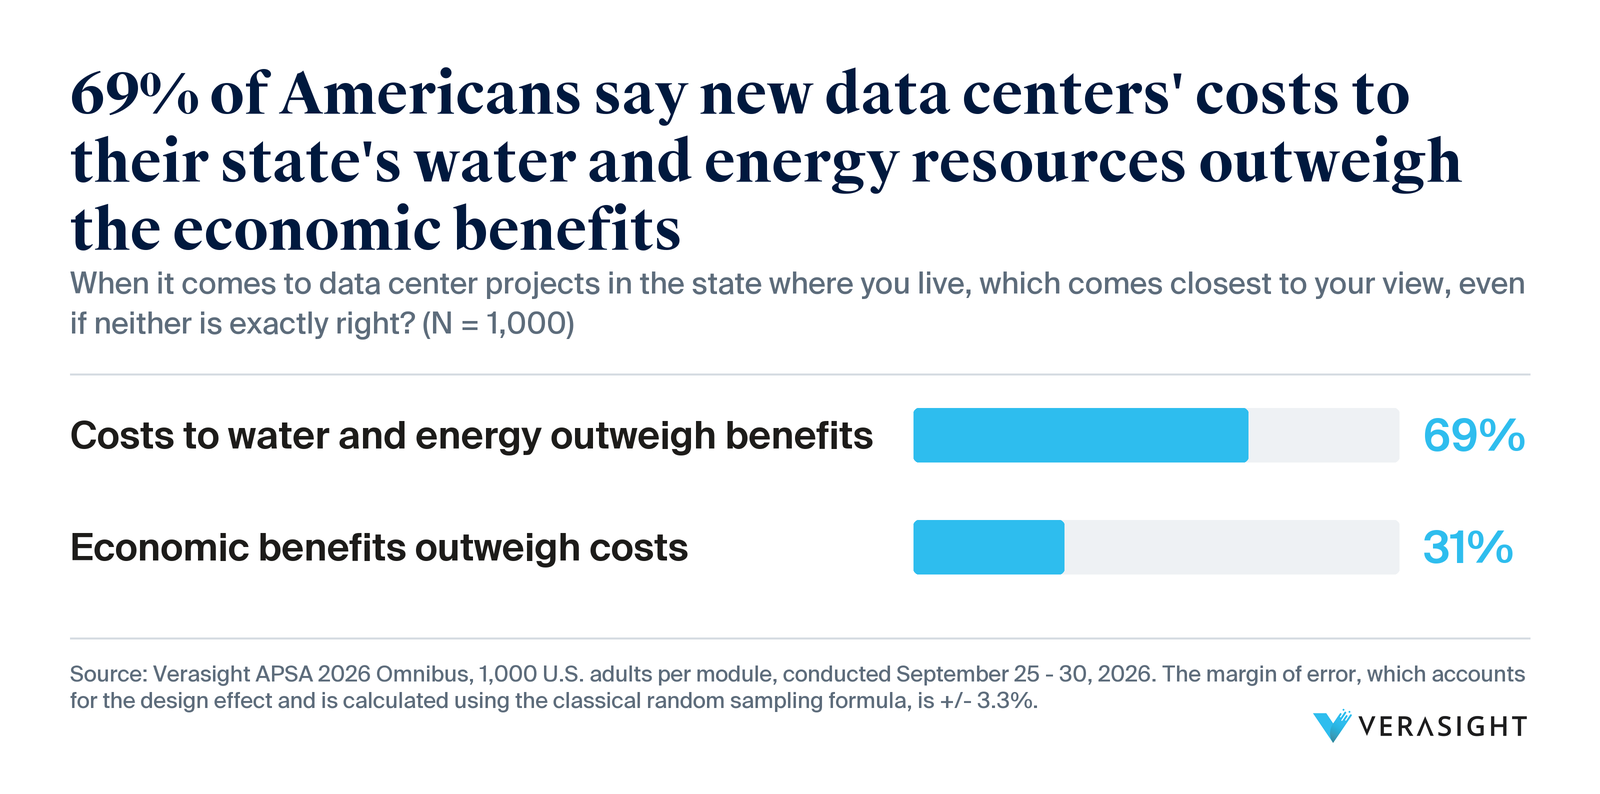
When asked which view comes closest to their own on data center projects in the state where they live, 69% of respondents said the costs of new data centers to their state's water and energy resources outweigh the economic benefits; 31% said the benefits outweigh the costs.
- 45% say data center development in their state is moving too fast, 20% say about the right speed, and 6% say too slow. Another 29% are not sure.
- 64% say ordinary residents have not very much or no influence over whether and where projects such as data centers are built.
About the data
- Survey: Verasight APSA 2026 Omnibus
- Sample: 3,000 U.S. adults, randomly assigned to one of three modules of 1,000
- Field dates: September 25 to 30, 2026
- Questions: 155, all submitted by attendees of the 2026 American Political Science Association (APSA) conference in Boston
- Margin of sampling error: +/- 3.5% for Democracy, Politics, & Participation; +/- 3.3% for Society, Culture, & Identity; +/- 3.4% for Technology, Security, and Global Affairs
- Weighting: to the July 2026 Current Population Survey on age, race/ethnicity, sex, income, education, region, and metropolitan status, plus partisanship (a three-year average of the Pew Research Center NPORS benchmarking surveys) and 2024 vote
Thank you to the APSA attendees who submitted questions.