

Abstract
Most evaluations of LLM-generated “synthetic” survey respondents score models on outcomes they could have seen in training. In this paper, we report the results of a true out-of-sample test of a synthetic data-generating pipeline applied to 14 competitive elections to the U.S. Senate in 2026. First, we extend Verasight’s existing synthetic response-generation pipeline from the national to state level, which entails drawing 1,000 “personas” per state from a 21-million-cell post-stratification frame calibrated to the results of the 2024 election and national benchmarks for party identification in 2026 from the Pew Research Center. Then, we extract vote-intention probabilities for these personas with GPT-6-sol, a state-of-the-art frontier LLM from OpenAI. Finally, we evaluate the performance of these forecasts against polls. Against preliminary election returns reported by The New York Times as of November 5, the synthetic-data forecasts missed the two-party margin across Senate races with a root-mean-square error of 8.3 points, and ran 5.7 points too Republican on average. Polling averages from the same time horizon (five weeks before Election Day) missed with a 6.4-point RMSE and a smaller 3.8-point uniform bias. Compared with subgroup estimates from the CNN Voter Poll, synthetic respondents got the direction of demographic divides right (r = 0.79) but compressed their size, and erred most among young voters, independents, and 2024 non-voters. We conclude that even on elections, arguably a best-case scenario for the method, synthetic samples did not match real polls.
Introduction
Tests of survey respondents generated by artificial intelligence, including by these authors, have been conducted almost entirely on outcomes that models could have seen in training. It is not impressive that an AI model, such as a large language model, trained on news articles and encyclopedia entries, which include mentions of election returns and results of other polling, could reproduce results of past elections and other surveys.
This report thus sets up an out-of-sample state-level test on outcomes that did not yet exist at the time of response generation. Specifically, we impute respondent-level data for the 2026 elections to the U.S. Senate as well as several questions from the as-yet-unpublished 2026 Cooperative Election Study (CES). These responses were generated by a publicly documented LLM-generated response imputer that extends Verasight’s previous investigations into LLM polls from the national to the state level. We also updated our response generation wrapper to use the latest state-of-the-art model from OpenAI, GPT-6.
The results of this test will constitute one of, if not the first, publicly available tests of a high-quality “digital twin” technology applied out of sample. By testing the performance of our synthetic data pipeline in forecasting the results of 14 Senate elections held in the 2026 midterms, we seek to learn the difference between how respondent-level LLM-generated survey data differs in accuracy in- and out-of-sample.
We find that synthetic forecasts frozen five weeks before the election missed the two-party margin in these races by 8.3 points (RMSE) and ran 5.7 points too Republican, calling 9 of 14 winners, while polling averages from the same day missed by 6.4 points, ran 3.8 points too Republican, and called 10. Synthetic respondents reproduced the direction of most subgroup divides but understated their size, and they erred most among voters without a firm partisan anchor: the young, unleaned independents, and people who did not vote in 2024.
{{inline-form}}
1. Existing approaches
Most tests of LLM-simulated opinion score the model against outcomes it may have read during training. A backtest like that cannot separate modelling skill from memory.
Argyle et al. (2023) used textual descriptions of thousands of respondents to the American National Election Studies (ANES) 2012–2020 panel survey to create different “personas” to feed to a LLM. The LLM was then asked to return the predicted vote choice for each respondent. These LLM-generated responses matched respondents’ actual vote choices at a rate of 90%. But Santurkar et al. (2023) found that these techniques work much better for majority demographic groups (especially whites) than others.
This work has also drawn critiques. Bisbee et al. (2024) found that synthetic answers vary far less than real ANES respondents, for example, and that the same model prompt gave different results over three months. Verasight’s reports (II, IV, V) compare synthetic national samples with real surveys. In our most recent analysis, “Can AI "digital twins" replace human respondents?”, we showed that LLM-imputed sample distributions differ from real survey data by about 6.6 percentage points on average.
But perhaps the biggest problem for champions of LLM-imputed “synthetic samples” is that there is no comprehensive public test of out-of-sample accuracy against real-world opinions. Some proponents also argue that comparing LLM-generated data to polls is inherently biased, since (in their worldview) the polls are so bad as to need to be replaced with LLM techniques. This presents an obvious opportunity to grade an AI survey system against real-world election results versus a traditional survey or poll.
We now present THESEUS-G, a sub-national (g)eographic extension of our LLM-powered response generation software, and have it generate out-of-sample forecasts for 14 of the most competitive 2026 Senate races. These forecasts were made and frozen on September 30 and October 2, 2026. The forecasts use gpt-6-sol, whose training data ends on April 20, 2026.
2. Proposed methodology
THESEUS-G borrows the post-stratification step of multilevel regression and post-stratification (MRP; Gelman and Little, 1997; Park et al., 2004) to extend our existing pipeline to the sub-national level. In this system, the LLM takes the place of the fitted regression, so nothing is estimated or pooled across cells. The model gives a probability for every answer for each respondent, so probabilities can be averaged up to state level using standard post-stratification methods.
THESEUS-G extends Verasight’s national THESEUS pipeline (see Verasight V) in two ways. First, the personas come from a calibrated post-stratification frame at the state level: whereas THESEUS imputed attitudes for sampled survey “agents” directly from the 5-year American Community Survey data and had no geographic fidelity, THESEUS-G can subset agents to the state (or lower) geographic levels. Second, every persona now carries information about an agent’s locality and politics, including its area’s presidential vote, demographic percentages such as white percent and percent in college, and an estimated 2024 vote and leaned party variable for each agent that matches (a) the results of the 2024 election and (b) national totals from NPORS, the national benchmark studies conducted by the Pew Research Center. This produces estimates that are calibrated to known targets politically — as a standalone poll might — and enables response generation at the state (and lower) geographic levels.
2.1 Population frame and personas
Personas are drawn from a novel post-stratification frame of the U.S. population that is calibrated to match known targets of the 2024 election and party ID from Pew’s NPORS surveys. The frame has 20,968,188 cells containing the joint distributions of state × Public Use Microdata Area (PUMA, a Census area of at least 100,000 people) × sex × age × race × education × income × 2024 vote × leaned party.
Frame construction starts by taking adult citizens in the Census Bureau’s American Community Survey, specifically the 5-year extract ending in 2025. Turnout and vote models are fit on the voter-validated CES and the Current Population Survey (CPS) voting supplement and projected onto the ACS. We use the voter-validated CES to train an MRP model to project 2024 vote choice for every cell. Then, for calibration, the modeled probabilities are shifted on the logit (log-odds) scale to match real election turnout and vote shares, which keeps each cell’s ranking (Ghitza and Gelman 2013; Kuriwaki et al. 2024).
We augment this voter-validated post-stratification frame finally with predicted party ID for every cell. This is accomplished by training a random forest model on the microdata for Pew’s 2026 National Public Opinion Reference Survey (NPORS), which can be used to model party ID conditional on all other demographic and political variables at the national level (including 2024 turnout and vote choice). We apply an adjustment to the predicted Democratic and Republican party ID percentages for cells in each state such that the state-level averages have geographic variation that matches what we see empirically in 2024 vote choice.
2.2 Prompting and verbalized sampling
As in our past studies, we then transform each cell in the post-stratification into a textual description, or “persona,” that can be fed into a large language model’s chat interface. This persona is written in the form of a short background interview, as if an interviewer had been conducting a survey of a voter and stopped right before asking them about attitudinal questions. The interview gives the persona’s age band, sex, race, education, family income, politics, and state of residence, and it states local PUMA-level partisanship as “In the part of {State} where I live, about X% of voters chose {Dem} and about Y% chose {Rep} in {year}”. The persona’s party is given as “The Democratic Party”, “The Republican Party” or “Neither party”.
We then feed these interviews into the Application Programming Interface for OpenAI’s GPT-6-sol, and request responses for vote intention for Senate candidates. The model returns a probability for every answer option rather than a single answer, a closed-question form of the technique called verbalized sampling (Zhang et al. 2025) detailed in Verasight V. Verbalized sampling elicits LLMs to return probabilities of all different responses to each survey question.
THESEUS-G “interviews” 1,000 synthetic respondents per state, drawn from PUMA-level post-stratification cells. Each cell has a probability of selection within each state with probability proportional to each cell’s size (number of registered voters).
3. Using synthetic data to forecast the 2026 Senate midterms
Now we turn to out-of-sample forecasts for key elections to the U.S. Senate in November 2026. The frozen forecast puts the Democratic or D-aligned candidate ahead in 8 of 14 races, for an expected 7.4 of those 14 seats (80% range: 2 to 13). Estimates for each state are shown in Table 1 below.

On average, the forecast is 9 points more favorable to Democrats than Harris’s 2024 margin in the presidential election. The biggest moves, 18 to 20 points toward the D-aligned side, are in Nebraska, Texas, and Alaska.
At the respondent level, the generated microdata show that Trump voters defect more than Harris voters. Each Harris voter gives the D-aligned candidate 0.81 to 0.92 votes on average, while Trump voters give the Republican just 0.75 to 0.86. The respondent-level data also show that 2024 non-voters lean Democratic now; in each state’s sample, 2024 non-voters and third-party voters are 20% to 32% of all registered voters, and they vote for Democrats 46% to 60% of the time (depending on the state).
4. Performance of predictions
Now, with the election results in hand, we can compare the forecasts from THESEUS-G to the election results and the horse race polls. We use returns reported by The New York Times as of 5:46 p.m. Eastern on November 5, when every race except Alaska had more than 95% of its expected vote counted. Every comparison uses the two-party margin between the Democratic (or D-aligned) candidate and the Republican, the same quantity the forecast predicts. In Nebraska, the D-aligned candidate is the independent Dan Osborn. In Alaska and Maine, which use ranked-choice voting, we score the first round. For the polls, we use the polling average calculated by the polling analysis website FiftyPlusOne for each race on two dates: September 30, the day the THESEUS-G Senate forecasts were frozen, and November 3, Election Day.
The headline is that 2026 was a much better year for Democrats than synthetic data suggested. D-aligned candidates won at least 11 of the 14 races sampled, including Iowa, Kansas, South Carolina and Michigan. In Alaska, with about three-quarters of the vote counted as of November 5, Dan Sullivan led Mary Peltola by 2 points in the first round. Later counts put Peltola ahead with 50.1% of first-round votes (Alaska Division of Elections, unofficial results as of November 17), which would make it 12. The error and winner figures in this report use the November 5 returns.

Yet THESEUS-G expected D-aligned candidates to win 7.4 of these seats, and in our simulations they won 11 or more only 25% of the time. On average, the forecasts were 5.7 points too Republican on margin when compared to November 5 vote tallies, and they missed the actual margin by 8.3 points (root-mean-square error, or RMSE). THESEUS-G favored Republicans who went on to lose in Iowa, Kansas, South Carolina and Michigan, and, on November 5 returns, it favored Peltola in Alaska. Its three biggest misses, 14 points in Iowa, 13 in Kansas and 11 in South Carolina, all came in red-leaning states that Democrats carried by 4 to 5 points.
Because we have access to synthetic predictions for the population post-stratification frame in every state, we can also analyze the accuracy of synthetic polls at the subgroup level. To do this, we compare the synthetic predictions against the CNN Voter Poll, a survey of between 1,000 and 5,200 voters conducted by SSRS (with 52,414 respondents recruited by Verasight) in each of the 14 Senate races, adjusted to the company’s estimates of the actual results of the election as of November 4. We aggregate the synthetic predictions within the same groups the Voter Poll reports (gender, age, race, education, income, party lean, and 2024 vote) and compute each group’s two-party margin between the D-aligned candidate and the Republican in every race. After dropping cells that aren’t common between the Voter Poll and our synthetic data, that leaves 294 group-by-race comparisons: 200 for demographic groups and the rest for party lean and 2024 vote.
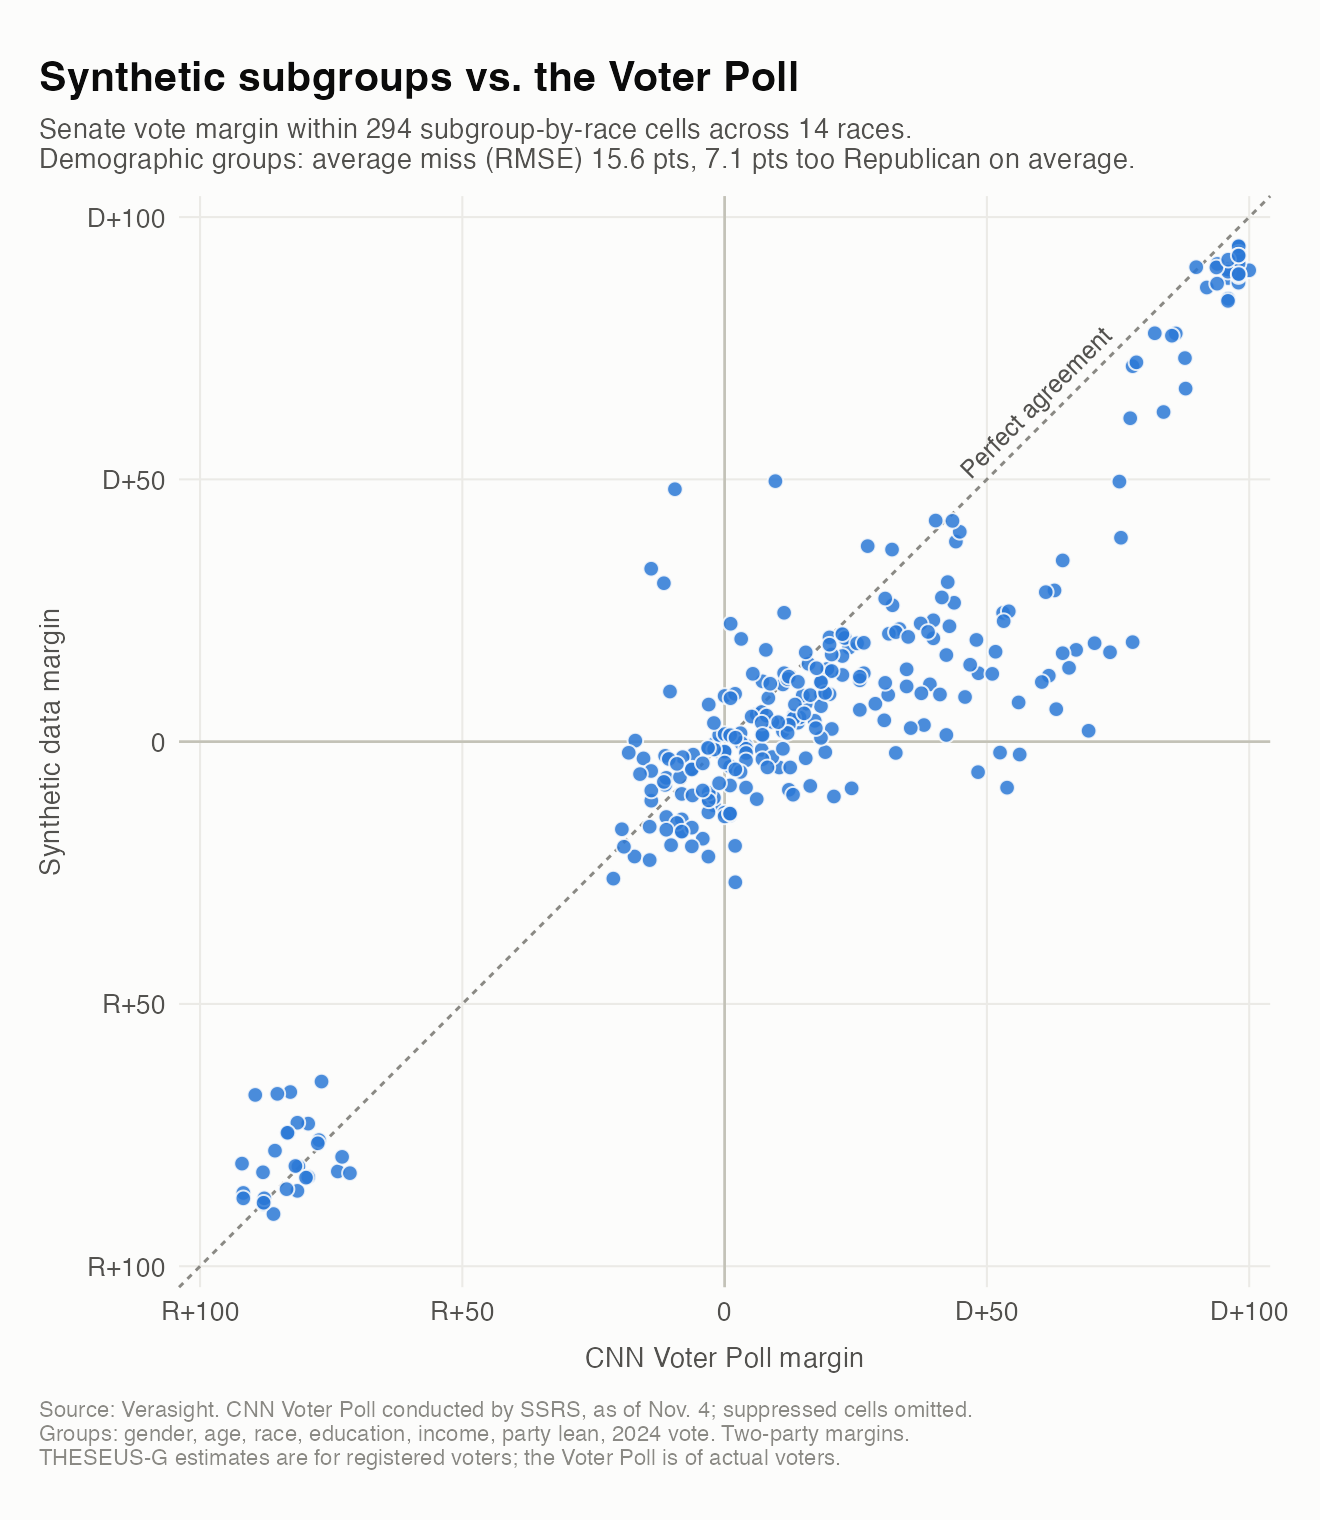
THESEUS-G gets the direction of most subgroup patterns right but makes the gaps too small. Across 200 demographic cells in the 14 Senate races, its subgroup margins correlate at 0.79 with the CNN Voter Poll. The average miss is 15.6 points, with a 7.1-point Republican bias. Errors for select demographic groups are shown in Table 2 below:
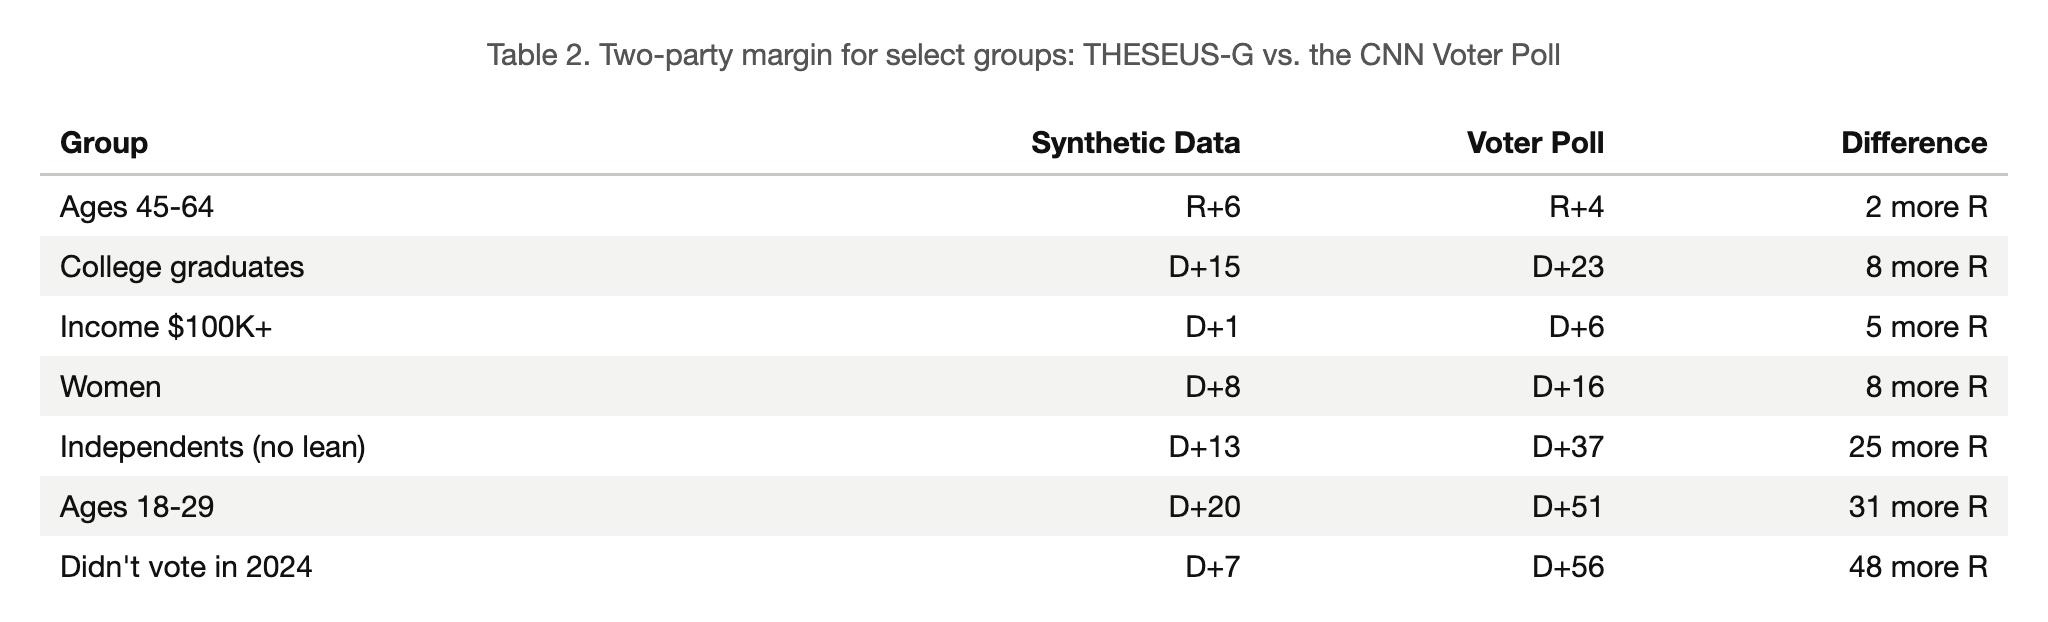
About 5.7 points of that bias is the statewide Republican lean showing up in every group. The rest comes from the model pulling group differences toward zero. Voters aged 18 to 29 backed the Democratic-aligned candidate by 51 points in the Voter Poll but by only 20 in THESEUS-G, while the 45-to-64 group was off by just two. The model also understated the gender and education gaps: women came out 8 points too Republican vs. 2 for men, and college graduates 8 vs. 1 for non-graduates. Black voters came out at D+67 vs. D+82. Accuracy varied by state too, with demographic RMSE around 10 points in Nebraska and Michigan and around 19 in Kansas, North Carolina and Alaska.
4.1 Synthetic data vs the polls in 2026
The largest misses are among voters without a firm partisan anchor. Self-identified partisans landed close to the Voter Poll: Democrats and Democratic leaners at D+89 vs. D+96, Republicans and Republican leaners at R+80 vs. R+82. That is expected, since party and 2024 vote are built into each synthetic respondent's persona. Independents with no lean, however, came out at D+13 against D+37 in the Voter Poll. People who didn't vote in 2024 came out at D+7 against D+56, which is the biggest gap in the comparison. Part of that gap reflects a difference in who is being measured. THESEUS-G models all registered voters, while the Voter Poll covers only people who actually turned out in 2026, and the 2024 non-voters who did turn out were clearly an unusually Democratic group. Some cells are also noisy on the Voter Poll side, such as Latino voters in Alaska or any group in Kansas and South Carolina, whose polls had about 1,000 respondents each. Even so, the pattern is consistent: the synthetic sample describes partisans well but misses the less attached, younger and lower-turnout voters who decided these races.
The polls did better than synthetic data. On September 30, the polling averages missed by 6.4 points and were 3.8 points too Republican on average; they called 10 of 14 winners. By Election Day, the average of polls had improved to an RMSE of 4.9 points and a Republican lean of 2.9 points. That was good enough to call 12 of 14 races, missing only Alaska and the South Carolina Senate race, which the averages had as a dead heat.
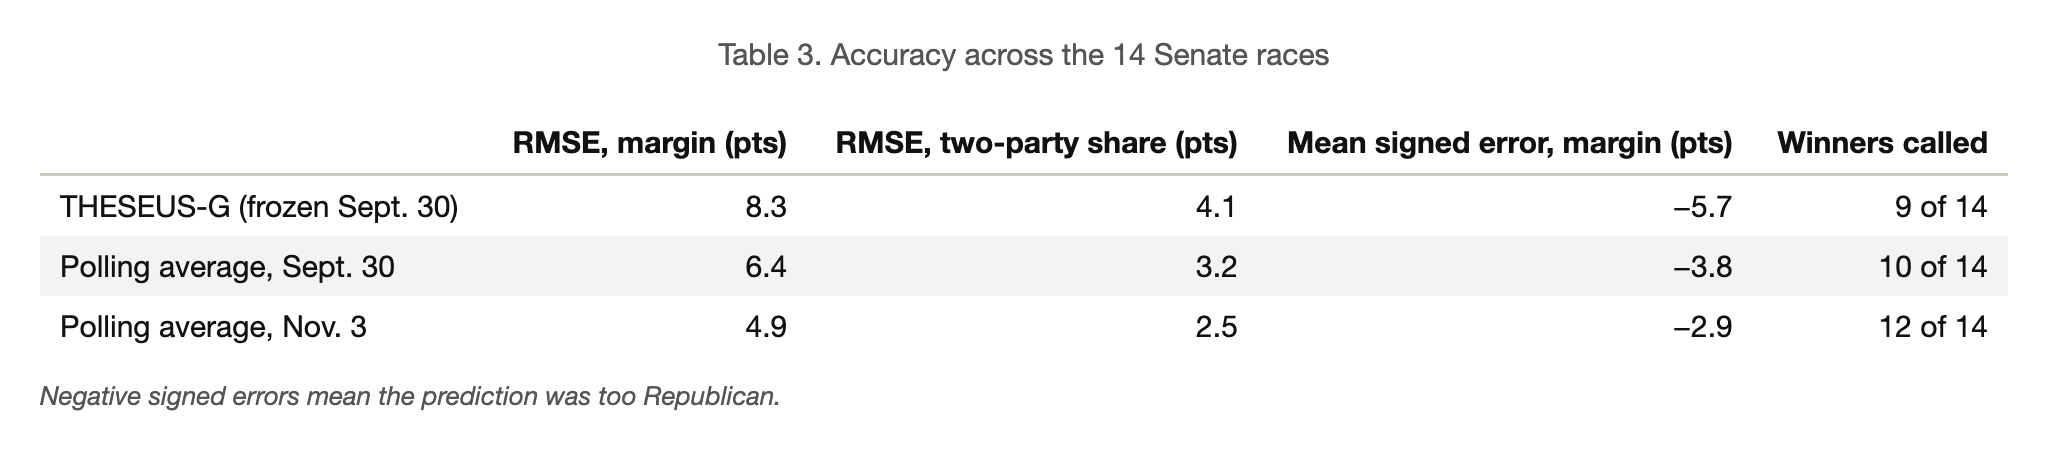
Put another way, the error of the synthetic forecast was about 30% larger than that of polls taken the same day, and about 70% larger than that of the final polls.
5. Conclusion
Proponents of AI-generated survey data claim that such technology outperforms polling averages by cutting down on factors like non-response and social desirability bias. But few firms have released any true out-of-sample tests against official population targets. This report is one such test, and its answer is clear: real polls beat synthetic data out of sample. That’s even true on elections, which, given polarization of vote choice by variables present on our post-stratification frame (e.g., ethnicity, past vote, party), can be thought of as sort of a best-case scenario for synthetic data.
THESEUS-G’s Senate forecasts were frozen five weeks before Election Day, using a model whose training data ended in April. Against polling averages from the same day, they were less accurate, more biased toward Republicans, and called fewer winners. The gap only widened as the campaign went on, because the polls kept learning about the race and a model with a fixed knowledge cutoff cannot. Any synthetic approach that hopes to compete with polls will have to solve that problem, not just the problem of making realistic respondents.
We also set out to learn how much accuracy LLM-generated data loses once it is out of sample. On the 2024 abortion referendums, gpt-6-sol, which may have seen those results in training, missed by 3.3 points of vote share, while the clean gpt-4.1-mini missed by 10.0. Out of sample in 2026, gpt-6-sol missed by 4.1 points. With only 14 races, and candidate elections instead of ballot measures, this is suggestive rather than conclusive. Still, it suggests that the contaminated backtest overstated accuracy only modestly, and that newer models produce meaningfully better synthetic respondents than older ones.
The synthetic data’s main failure was systematic. The personas are anchored to how people voted in 2024 (representative of all registered voters) and to their party identification in mid-2026. The LLM moved them about 9 points toward Democrats when the electorate moved about 16. The polls also underestimated Democrats, so 2026 was a hard year to measure for everyone, but real respondents got much closer.
The lesson for researchers and survey buyers is that synthetic samples are not yet a substitute for election polls. Verasight’s prior work on this subject has found that AI-generated survey data using a “digital twins” approach to response imputation with large language models differs from real survey benchmarks by about 6.6 points on average, and by as much as 12.8 points on a question about an event that happened after the model was trained. In this test, performance is similar — and on a test that synthetic survey responses should comparatively excel at. Despite claims by boosters of this technology, we have found no case where synthetic respondents can convincingly match the performance of human respondents.
How to cite this report
Morris, G. Elliott, Benjamin Leff, and Peter K. Enns. 2026. “Did Synthetic ‘Polls’ Beat Real Surveys in the 2026 Senate Elections? No.” Verasight.